Fig. 3.
Download original image
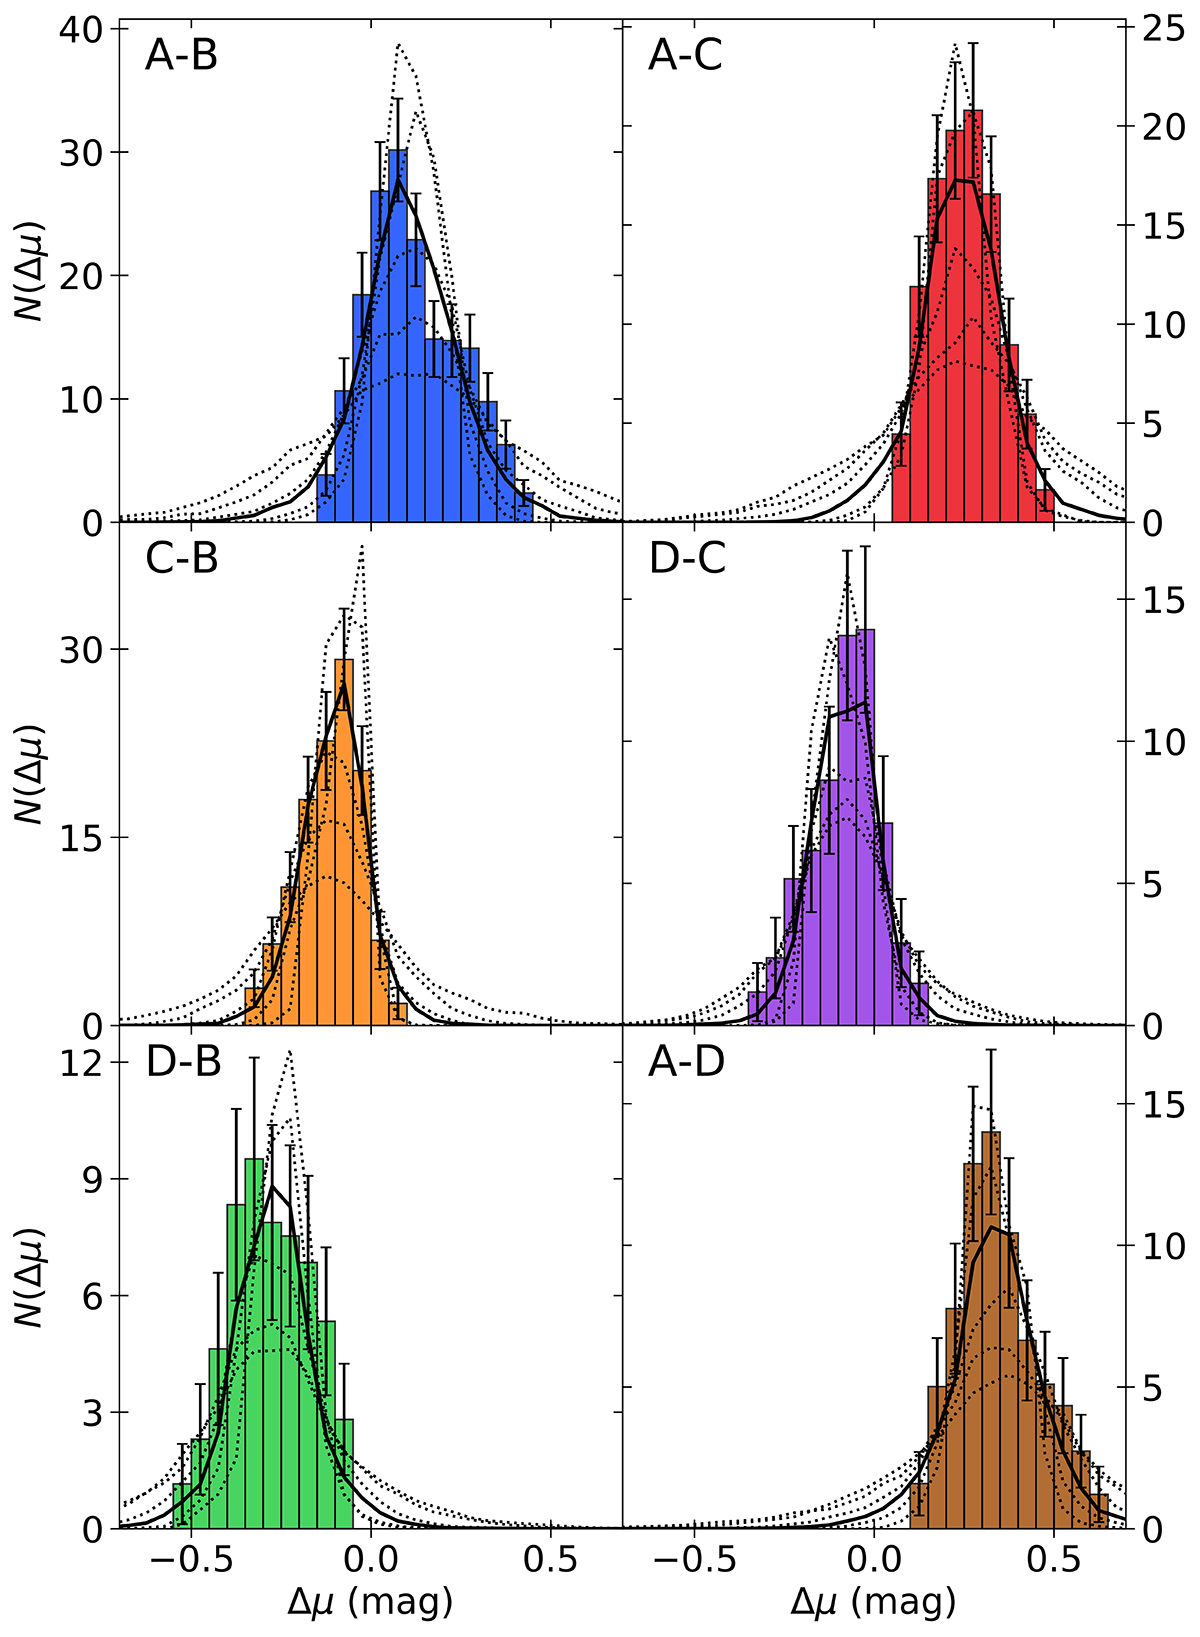
Observed histograms of the six possible microlensing differences obtained after averaging the 106 realisations from the Monte Carlo sampling. The error bars are the standard deviation of these realisations. The solid black lines represent the best model difference histograms, and the thin dotted lines are other model histograms used for the parameter inference.
Current usage metrics show cumulative count of Article Views (full-text article views including HTML views, PDF and ePub downloads, according to the available data) and Abstracts Views on Vision4Press platform.
Data correspond to usage on the plateform after 2015. The current usage metrics is available 48-96 hours after online publication and is updated daily on week days.
Initial download of the metrics may take a while.