Open Access
Fig. 2.
Download original image
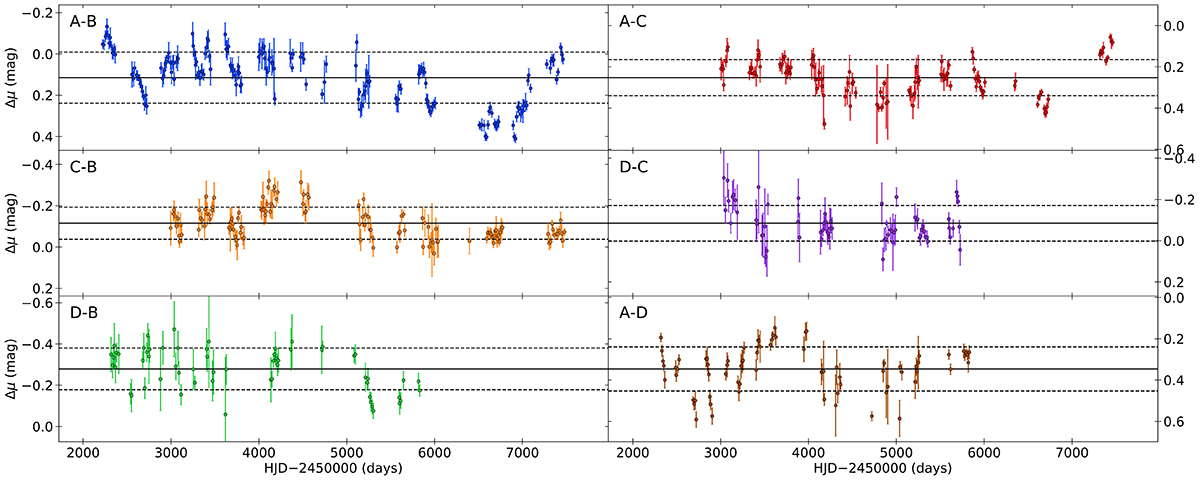
Microlensing differences between the six possible combinations of image pairs. The solid black lines are the mean of the micro-magnification, and the dashed lines correspond to the standard deviation. All light curves are shifted to match the time reference of the leading image, C.
Current usage metrics show cumulative count of Article Views (full-text article views including HTML views, PDF and ePub downloads, according to the available data) and Abstracts Views on Vision4Press platform.
Data correspond to usage on the plateform after 2015. The current usage metrics is available 48-96 hours after online publication and is updated daily on week days.
Initial download of the metrics may take a while.