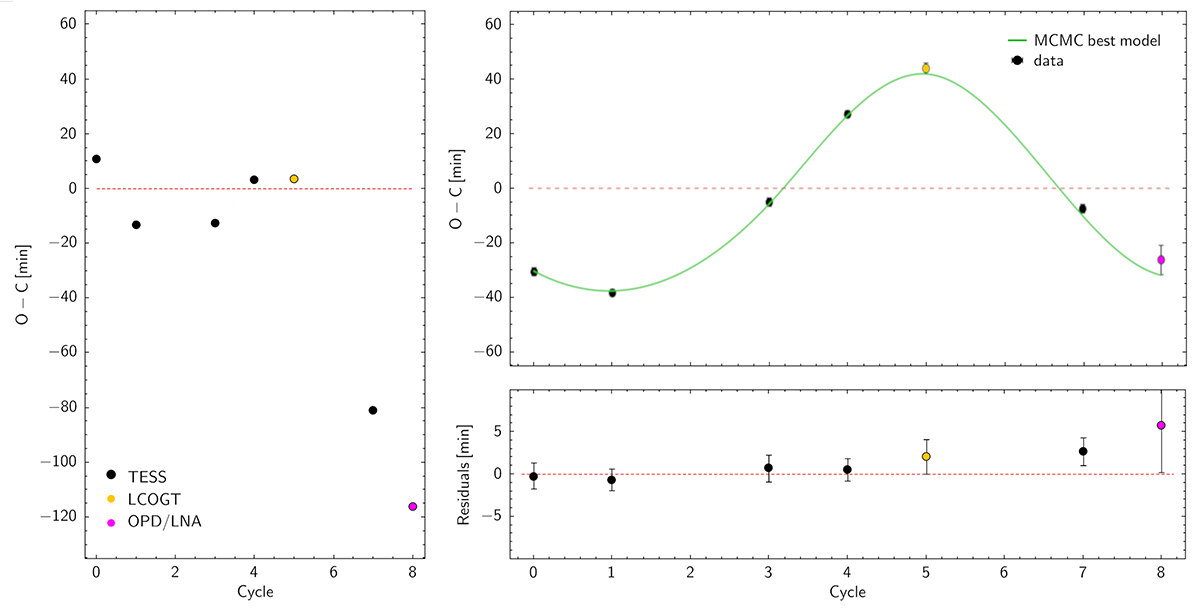
Fig. 2.
Download original image
O − C diagrams of the TOI-4562 b transit. Left panel: O − C diagram for all seven events according to the HEI23 ephemeris. In addition to the large O − C value for cycle #8 observed from OPD/LNA, the O − C for cycle #7 observed by TESS is also notable. Top right panel: O − C diagram of the TOI-4562 b transits, according to the ephemeris described in Equation (1). The observed midtransit times are shown as filled circles, while the model is shown as a green curve. Bottom right panel: Residuals from the fitting in the top right panel, with the respective error bars. The colour coding of the data points denotes the observatory and is the same in all panels: black for TESS, yellow for LCOGT, and magenta for OPD/LNA.
Current usage metrics show cumulative count of Article Views (full-text article views including HTML views, PDF and ePub downloads, according to the available data) and Abstracts Views on Vision4Press platform.
Data correspond to usage on the plateform after 2015. The current usage metrics is available 48-96 hours after online publication and is updated daily on week days.
Initial download of the metrics may take a while.