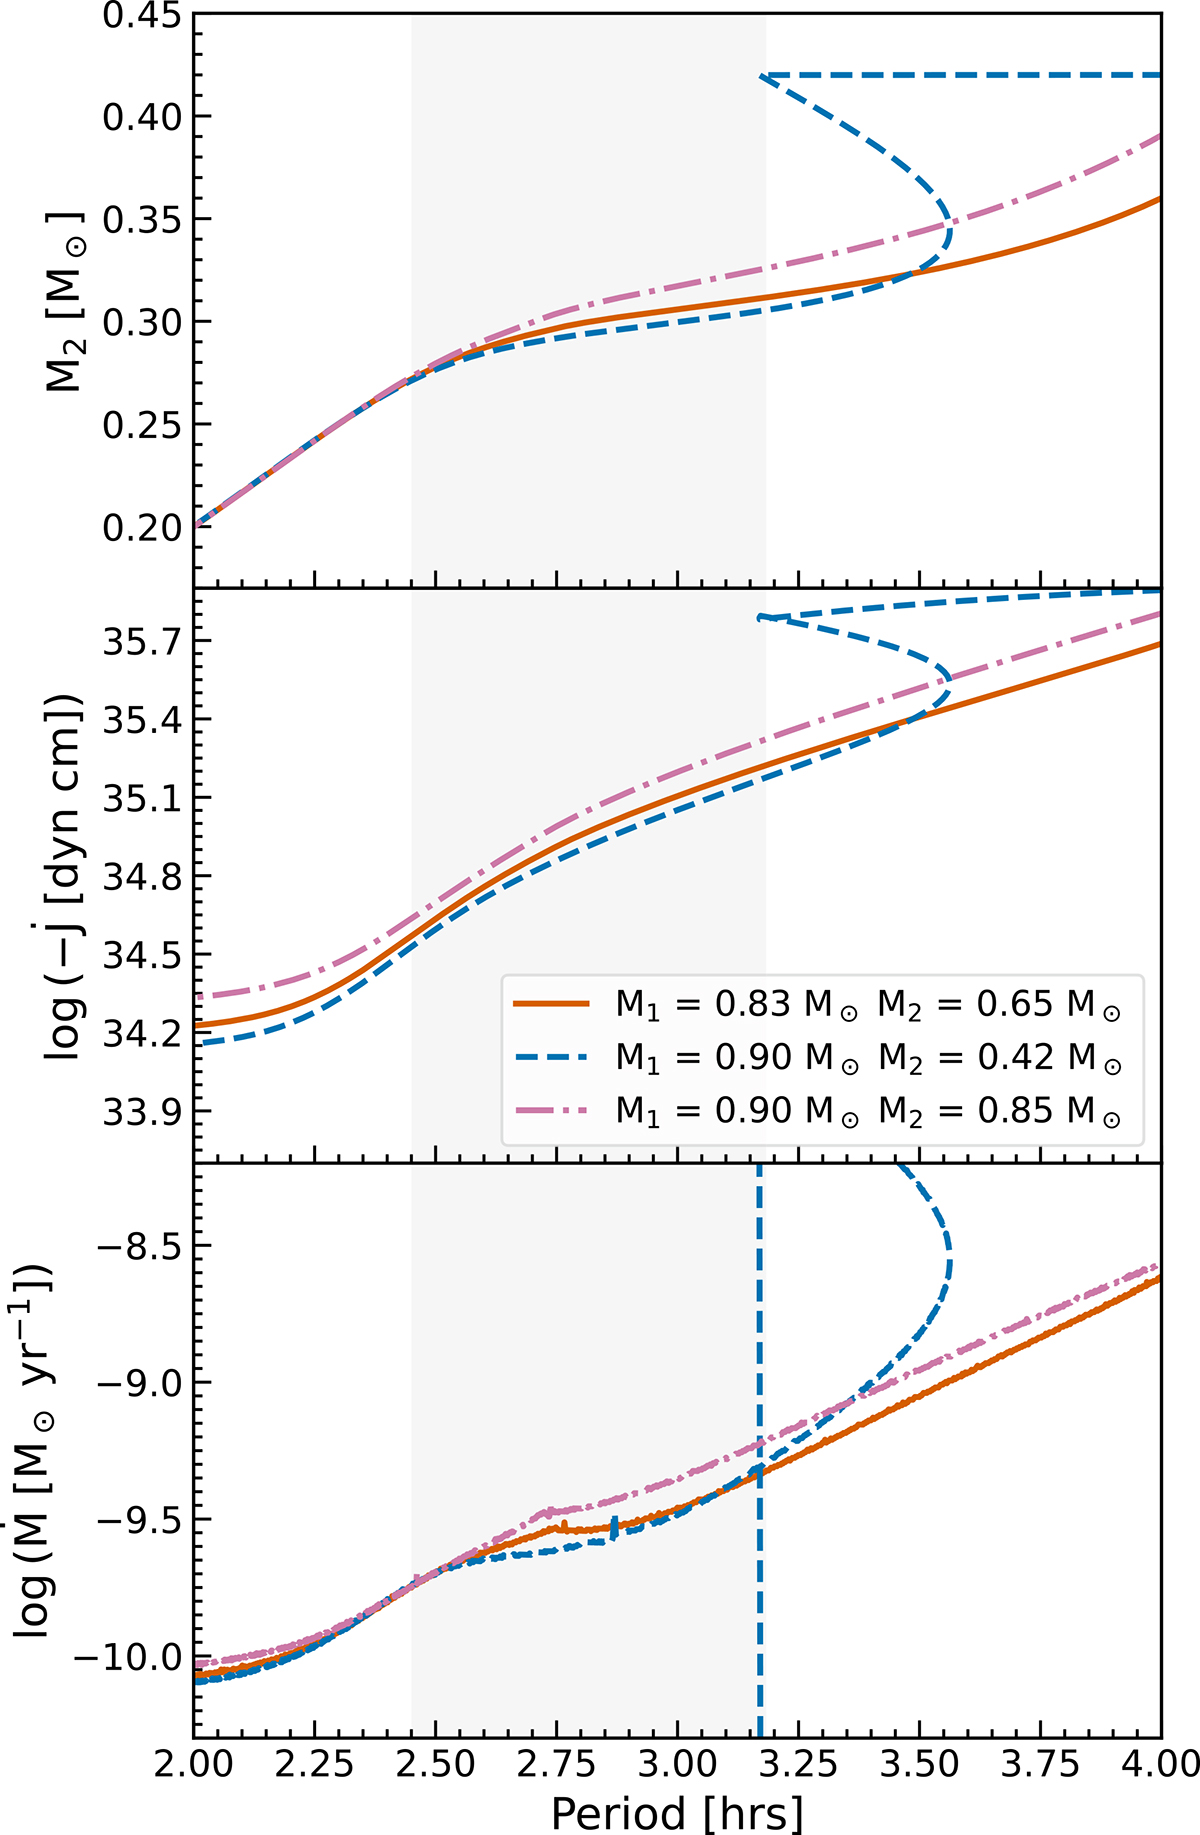
Fig. 4.
Download original image
Evolution of the donor mass (upper panel), angular momentum loss rate (central panel), and mass transfer rate (lower panel) for CVs with M1 = 0.9 M⊙, M2 = 0.42 M⊙ (dashed blue line), M1 = 0.83 M⊙, M2 = 0.65 M⊙ (solid orange line), and M1 = 0.9 M⊙, M2 = 0.85 M⊙ (dash-dotted pink line). The angular momentum loss rate is calculated as in CG18b. The shaded region corresponds to the period gap according to Schreiber et al. (2024). The dashed grey vertical line indicates the lower period gap edge according to Knigge et al. (2011). For the lowest-mass donor (blue track), the onset of mass transfer occurs close to the upper edge of the period gap, and the binary evolves through a well-known loop (often called the period flag) at the onset of mass transfer (e.g. Stehle et al. 1996, their Fig. 4). As the donor stars do not detach from their Roche lobe, the considered magnetic braking model cannot explain this crucial feature in the observed period distribution.
Current usage metrics show cumulative count of Article Views (full-text article views including HTML views, PDF and ePub downloads, according to the available data) and Abstracts Views on Vision4Press platform.
Data correspond to usage on the plateform after 2015. The current usage metrics is available 48-96 hours after online publication and is updated daily on week days.
Initial download of the metrics may take a while.