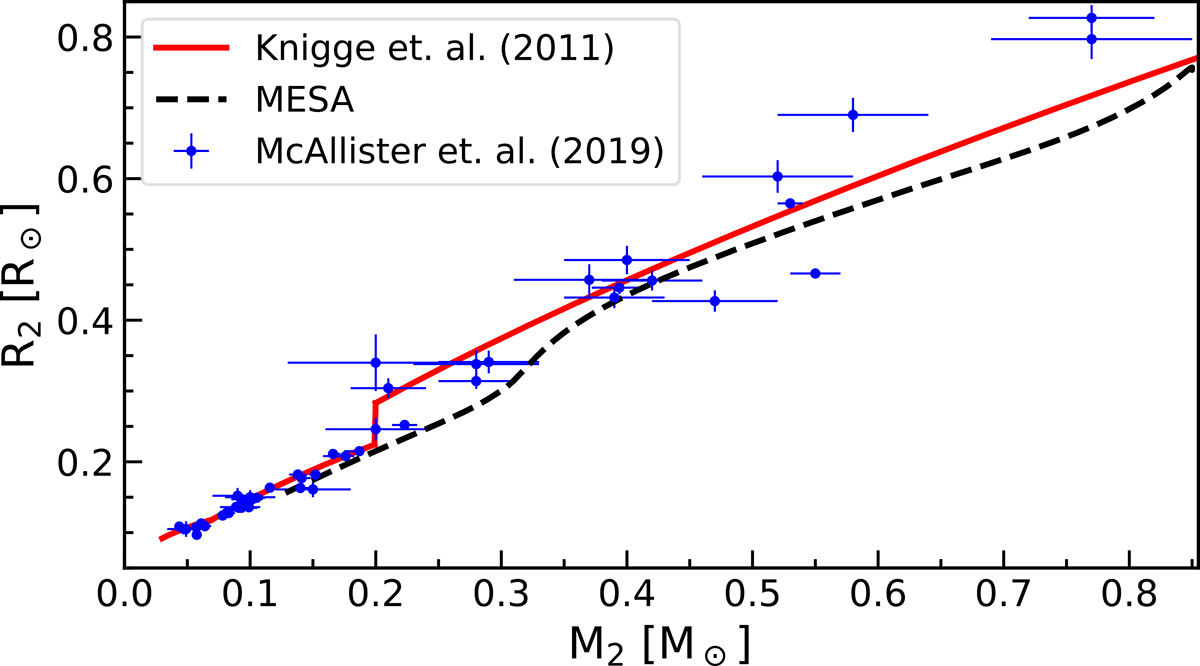
Fig. 3.
Download original image
Donor star radius (R2) as a function of its mass (M2) according to Knigge et al. (2011) (dashed red line) compared to the evolution predicted by MESA for a CV with initial M1 = 0.9 M⊙ and M2 = 0.85 M⊙ and assuming magnetic wind braking as in CG18b (solid black line). The radii and masses of CV donors derived from observations (McAllister et al. 2019) are shown as blue dots with their respective error bars. It is clear that the prescription based on the complexity of the field fails to reproduce the observations.
Current usage metrics show cumulative count of Article Views (full-text article views including HTML views, PDF and ePub downloads, according to the available data) and Abstracts Views on Vision4Press platform.
Data correspond to usage on the plateform after 2015. The current usage metrics is available 48-96 hours after online publication and is updated daily on week days.
Initial download of the metrics may take a while.