Fig. 2.
Download original image
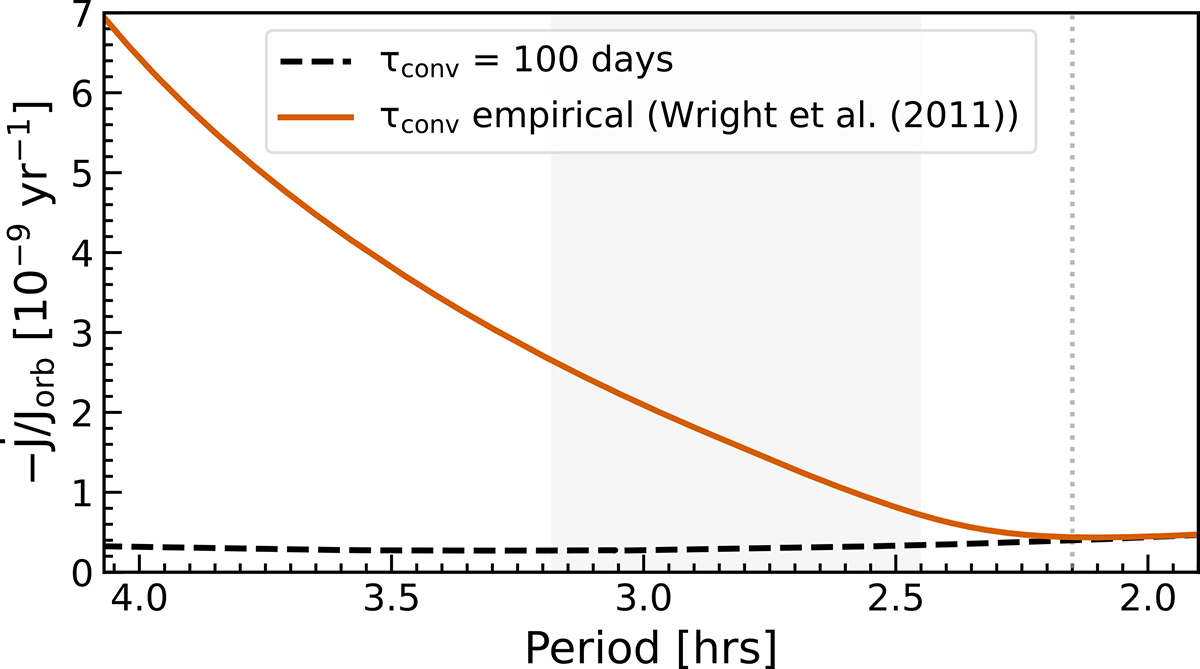
Relative angular momentum loss of CVs with M1 = 0.83 M⊙ and M2 = 0.65 M⊙, with a constant τ = 100 days (dashed black line) calculated using the empirical relation from Wright et al. (2011, solid orange line). The shaded region corresponds to the period gap for non-polar CVs according to Schreiber et al. (2024). The dashed grey vertical line indicates the lower period gap edge according to Knigge et al. (2011).
Current usage metrics show cumulative count of Article Views (full-text article views including HTML views, PDF and ePub downloads, according to the available data) and Abstracts Views on Vision4Press platform.
Data correspond to usage on the plateform after 2015. The current usage metrics is available 48-96 hours after online publication and is updated daily on week days.
Initial download of the metrics may take a while.