Fig. 1.
Download original image
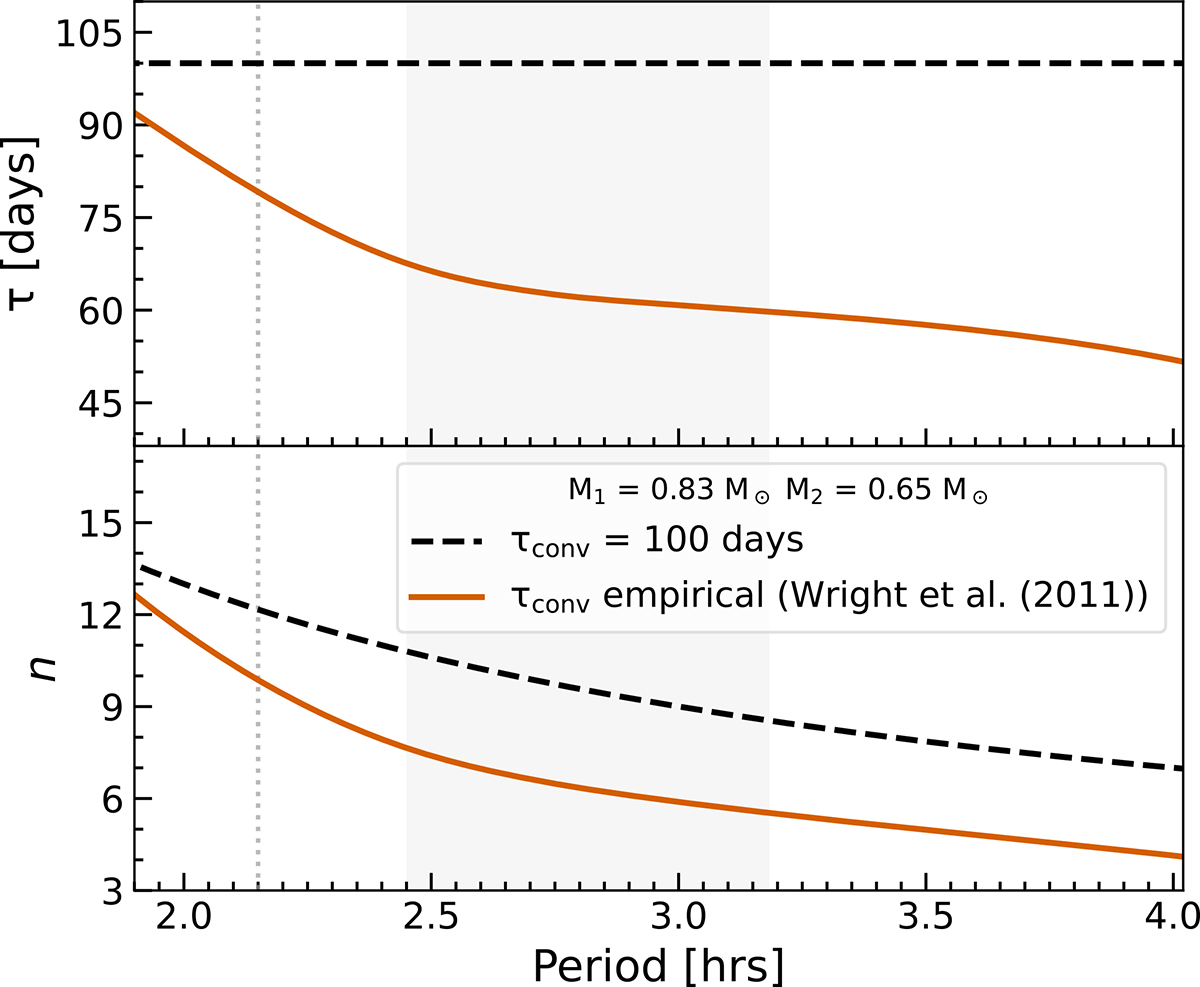
Comparison of the turn-over time, τ, evolution (upper panel) based on the empirical relation proposed by Wright et al. (2011, solid orange line) and a constant value of 100 days (dashed black line) and the corresponding magnetic field complexities, n (lower panel). The shaded region corresponds to the period gap for non-polar CVs according to Schreiber et al. (2024). The dashed grey vertical line indicates the lower period gap edge according to Knigge et al. (2011). The assumption of a constant turn-over time is not justified, and it is incompatible with the condition n < 7.
Current usage metrics show cumulative count of Article Views (full-text article views including HTML views, PDF and ePub downloads, according to the available data) and Abstracts Views on Vision4Press platform.
Data correspond to usage on the plateform after 2015. The current usage metrics is available 48-96 hours after online publication and is updated daily on week days.
Initial download of the metrics may take a while.