Fig. 8
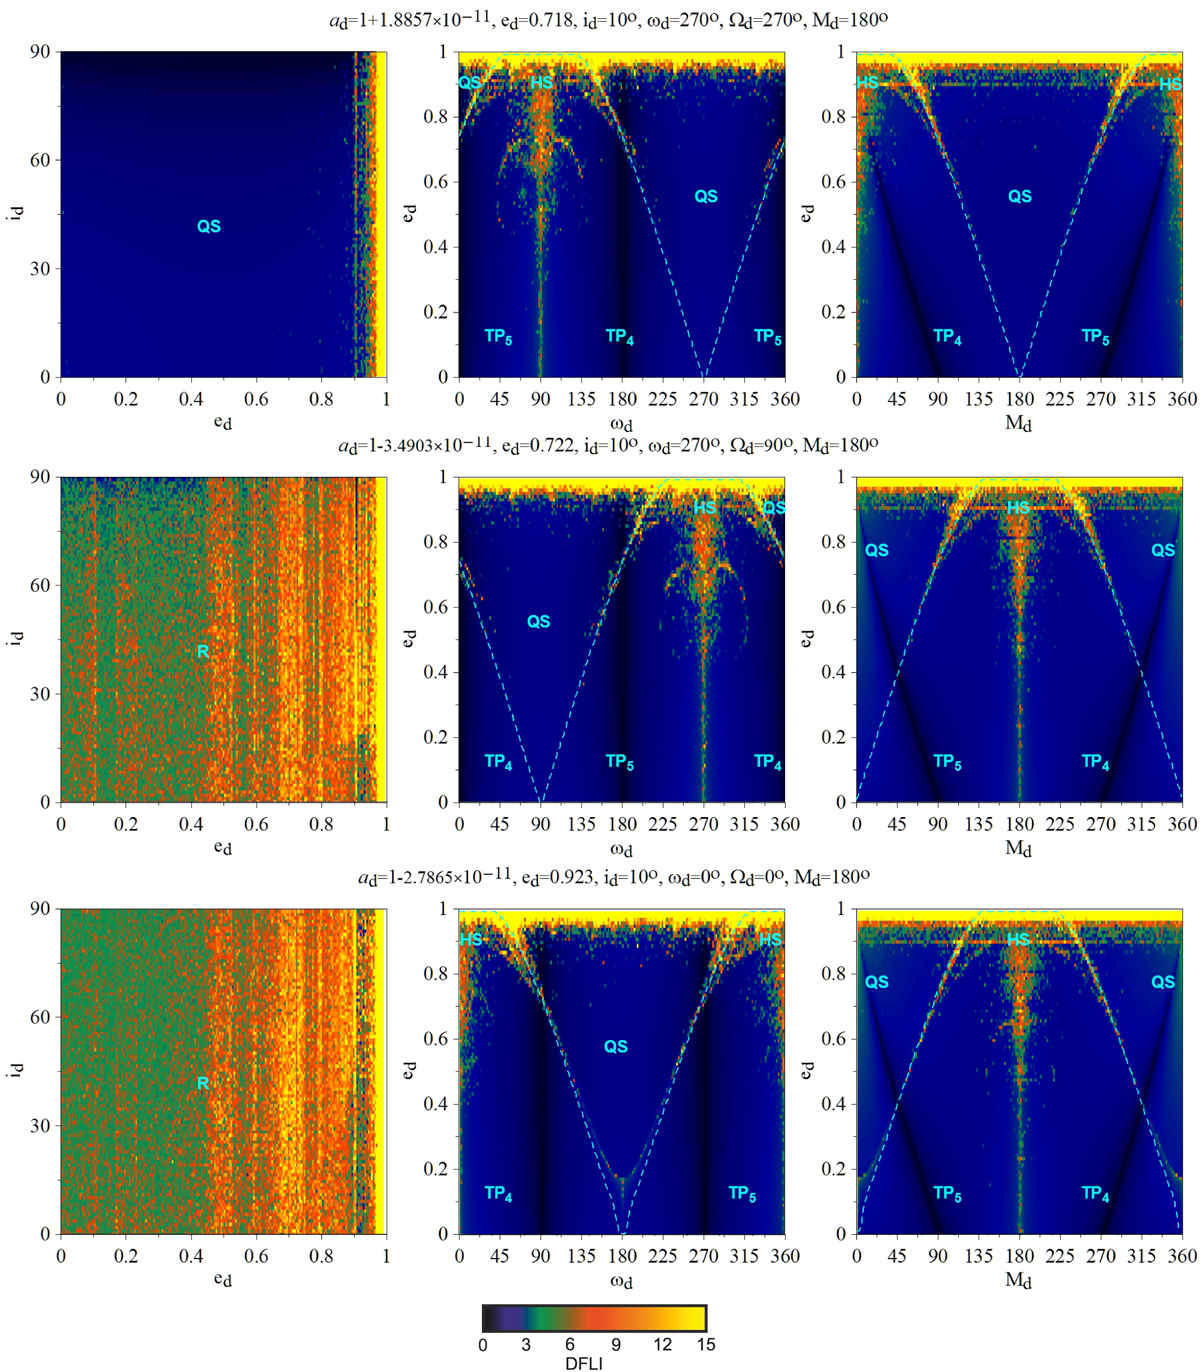
Download original image
DS maps for ∆i = 10° guided by a stable periodic orbit of the FI family (top) and an unstable periodic orbit of the FII′ family (middle) and GII′ family (bottom). The chosen initial conditions, which remained fixed while some varied for the computation of each grid, are reported above each row (see also Table 3). The dashed cyan curves depict the collisions and close encounters between the bodies. In the areas denoted by QS and HS, θ librates about 0 and 180°, respectively. TP4 and TP5 stand for the regular domains created by the asymmetric families generated by L4 and L5, where θ librates accordingly. R denotes areas in which θ rotates. Dark (pale) colours show regular (chaotic) orbits.
Current usage metrics show cumulative count of Article Views (full-text article views including HTML views, PDF and ePub downloads, according to the available data) and Abstracts Views on Vision4Press platform.
Data correspond to usage on the plateform after 2015. The current usage metrics is available 48-96 hours after online publication and is updated daily on week days.
Initial download of the metrics may take a while.