Fig. 17
Download original image
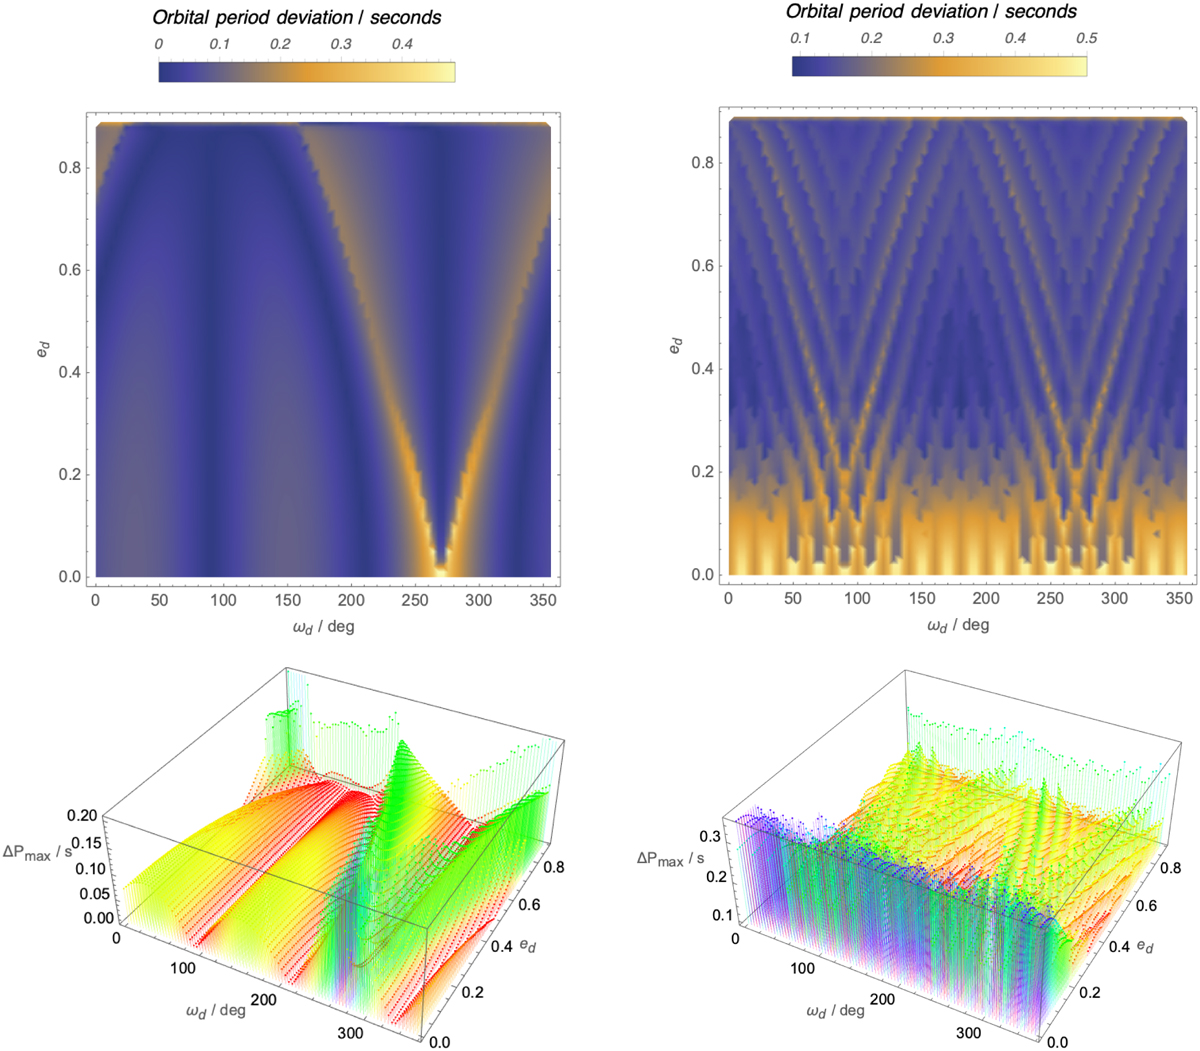
Simulations on the (Ωd, ed) plane (top row) and in the (Ωd, ed, ∆Pmax) space (bottom row) guided by the 3D QS periodic orbit with ∆Ω = 270° and ∆i = 10° that formulated the respective DS map in Fig. 8 (top middle panel). In the left column, Md = 180°, while it is uniformly sampled and incorporates orbits around the 3D QS periodic orbit on the right.
Current usage metrics show cumulative count of Article Views (full-text article views including HTML views, PDF and ePub downloads, according to the available data) and Abstracts Views on Vision4Press platform.
Data correspond to usage on the plateform after 2015. The current usage metrics is available 48-96 hours after online publication and is updated daily on week days.
Initial download of the metrics may take a while.