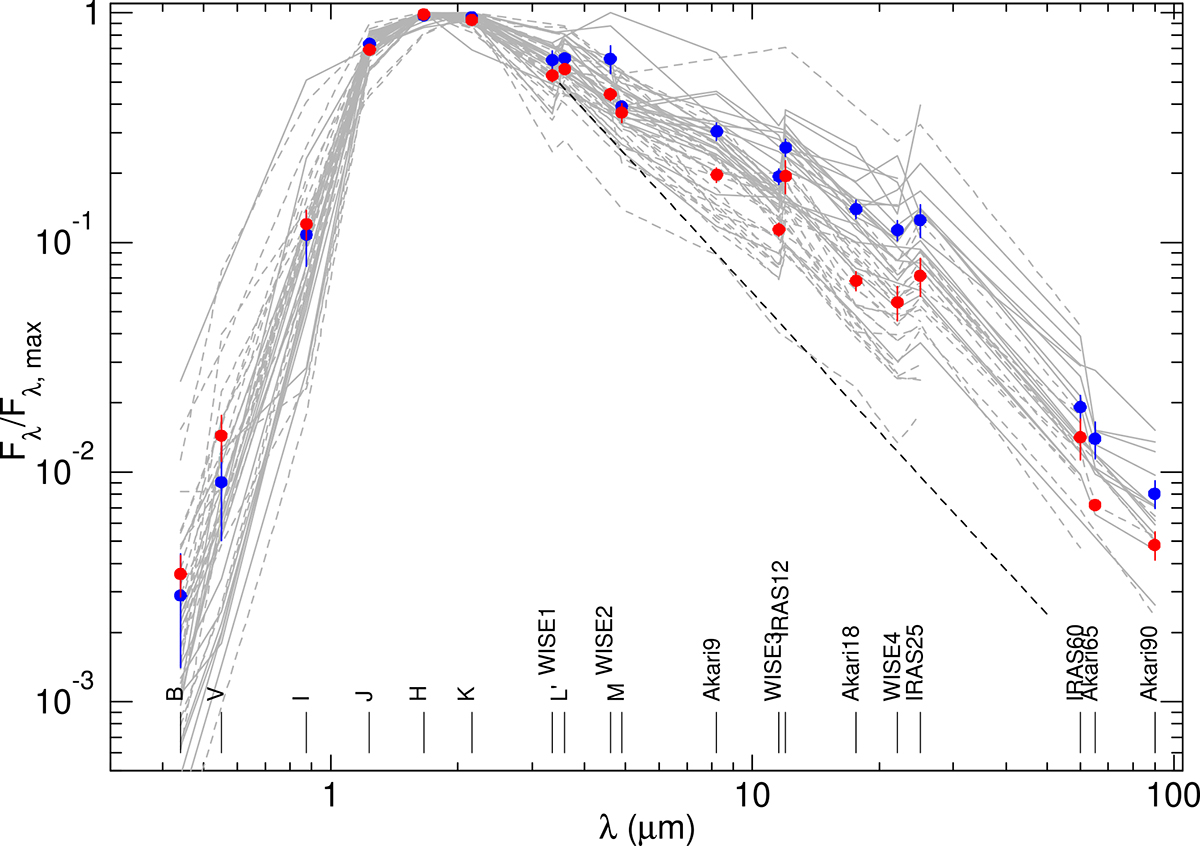
Fig. 9.
Download original image
Average SEDs of 21 Tc-poor and 26 Tc-rich Miras in the period range 280−350 d. Individual SEDs are plotted in grey in the background, where solid lines represent SEDs of Tc-poor Miras and dashed lines Tc-rich ones. Their average SEDs are represented by blue (Tc-poor) and red (Tc-rich) circles, the vertical bars indicate the standard deviation of the mean in each photometric band. The photometric bands and their central wavelengths are indicated at the bottom of the figure. The black dashed line indicates a λ−2 law extending from the W1 band to indicate the flux of a dust-free stellar photosphere. As can be seen, the Tc-poor Miras are brighter throughout the IR range than the Tc-rich ones.
Current usage metrics show cumulative count of Article Views (full-text article views including HTML views, PDF and ePub downloads, according to the available data) and Abstracts Views on Vision4Press platform.
Data correspond to usage on the plateform after 2015. The current usage metrics is available 48-96 hours after online publication and is updated daily on week days.
Initial download of the metrics may take a while.