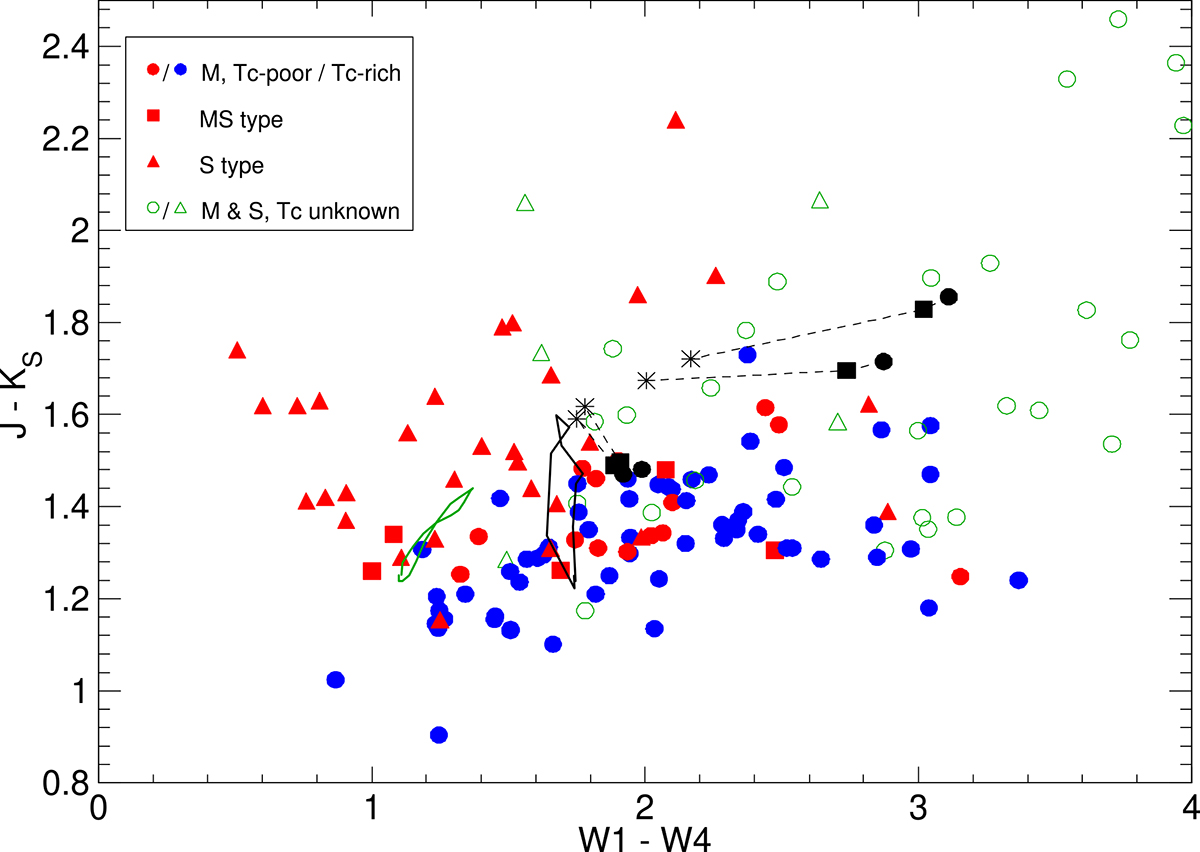
Fig. 8.
Download original image
J − KS vs. W1 − W4 colour–colour diagram with symbols as in Fig. 7. The figure merges the samples shown in Figs. 6 and 7. Dashed lines connect the DUSTY-based stationary wind models with the same MLR, increasing from left to right. The green and black lines are the DARWIN models An114u4 and M2n315u6 from Fig. 6 (Bn114u4 almost coincides with An114u4).
Current usage metrics show cumulative count of Article Views (full-text article views including HTML views, PDF and ePub downloads, according to the available data) and Abstracts Views on Vision4Press platform.
Data correspond to usage on the plateform after 2015. The current usage metrics is available 48-96 hours after online publication and is updated daily on week days.
Initial download of the metrics may take a while.