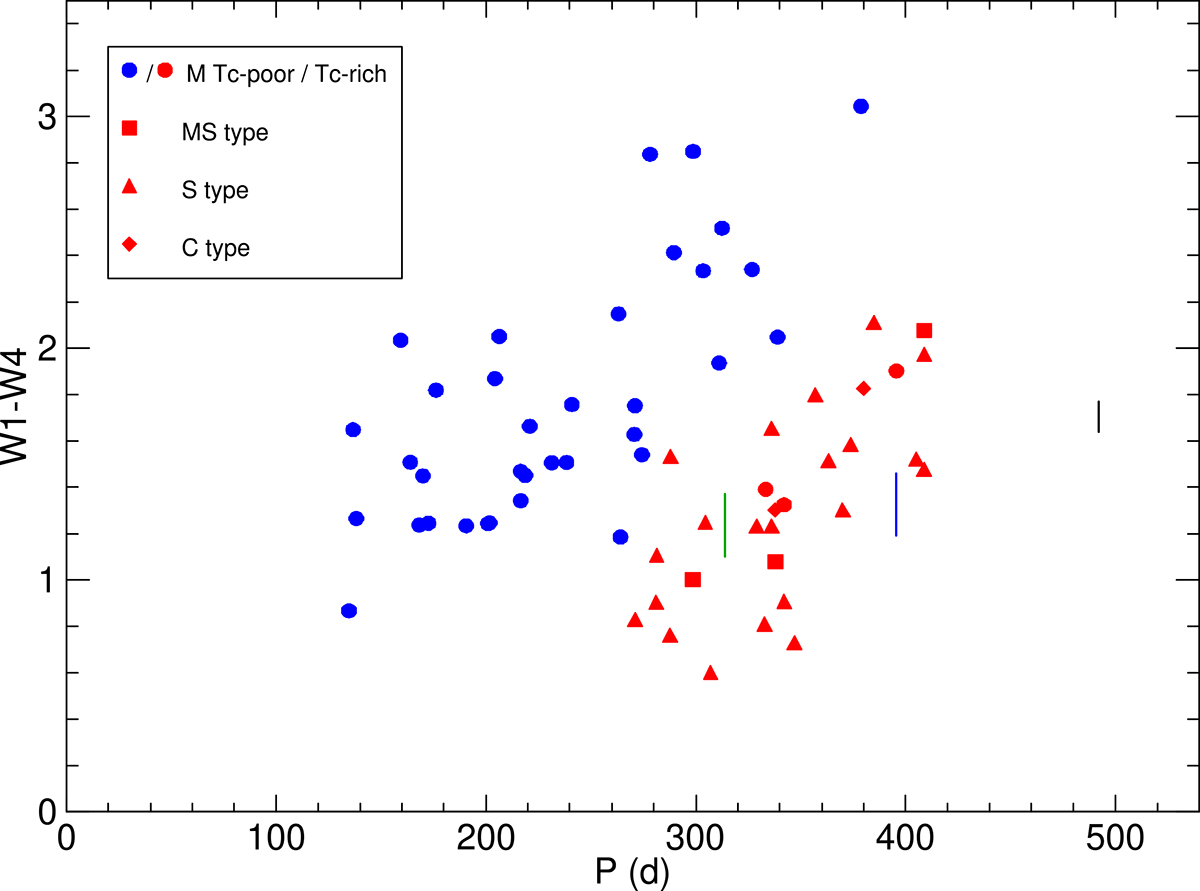
Fig. 6.
Download original image
W1 − W4 vs. P diagram of the Miras with Tc observation and W1 photometry in the WISE All-Sky Data Release. Symbols are as in Fig. 4. For comparison, the vertical lines show the maximum colour variation of three DARWIN dynamical wind models with Fe-rich dust: An114u4 (green), Bn114u4 (blue), and M2n315u6 (black). The model parameters are summarised in Table 3.
Current usage metrics show cumulative count of Article Views (full-text article views including HTML views, PDF and ePub downloads, according to the available data) and Abstracts Views on Vision4Press platform.
Data correspond to usage on the plateform after 2015. The current usage metrics is available 48-96 hours after online publication and is updated daily on week days.
Initial download of the metrics may take a while.