Fig. 3.
Download original image
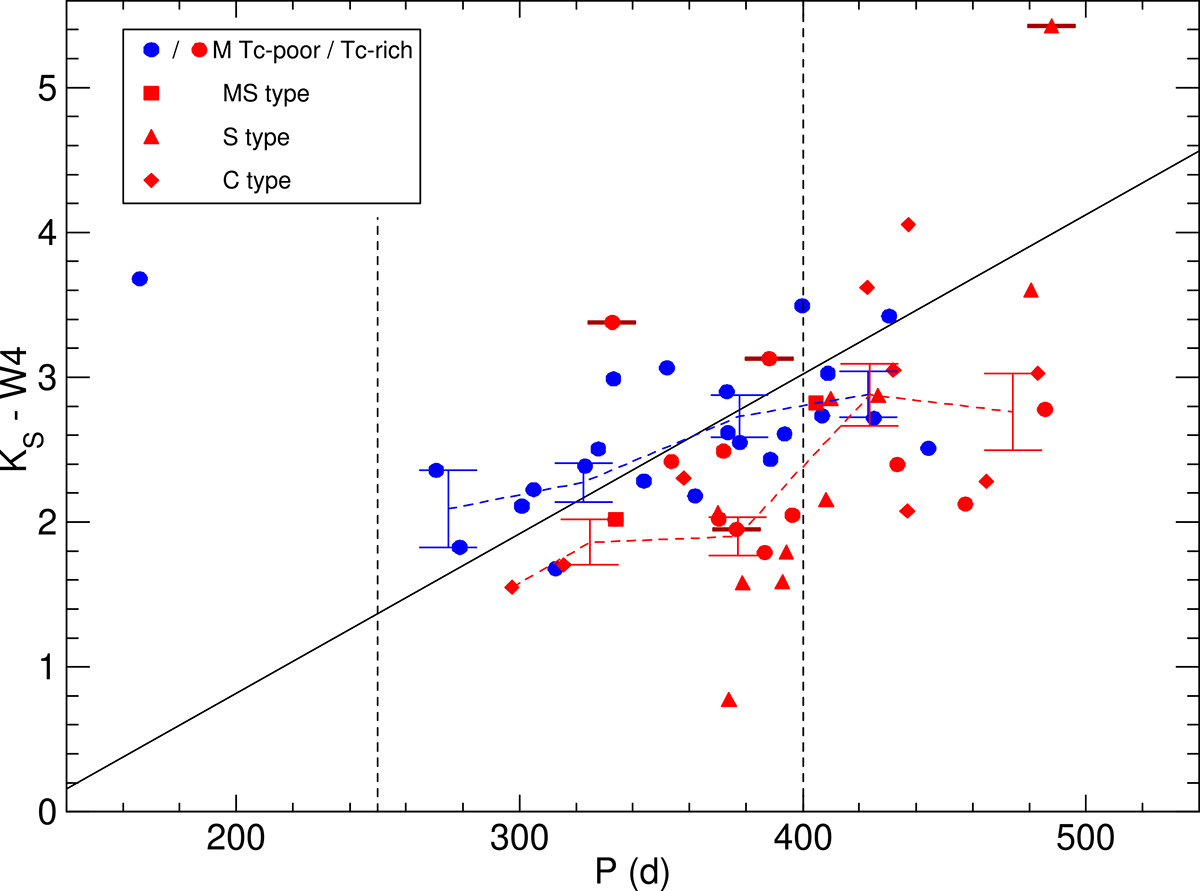
KS − W4 vs. P diagram of the stars with Tc and ML observations. Tc-poor stars are shown in blue, and Tc-rich ones in red. Different symbols distinguish spectral subtypes; see the legend. The dashed vertical lines mark the period range 250−400 d, in which the dichotomy between Tc-poor and Tc-rich Miras was found to be most apparent in Paper II. The solid line is optimised to best separate Tc-poor and Tc-rich Miras; see also Paper II. The run of the mean K − W4 colour in 50 d period bins is represented by the blue and red dashed lines with error bar symbols for Tc-poor and Tc-rich Miras, respectively. The size of the vertical bar is scaled to the standard deviation of the mean. The binaries, marked by horizontal dashes, have been excluded from calculating the means; sorted by increasing period, these are: o Cet, R Hya, R Aqr, and W Aql.
Current usage metrics show cumulative count of Article Views (full-text article views including HTML views, PDF and ePub downloads, according to the available data) and Abstracts Views on Vision4Press platform.
Data correspond to usage on the plateform after 2015. The current usage metrics is available 48-96 hours after online publication and is updated daily on week days.
Initial download of the metrics may take a while.