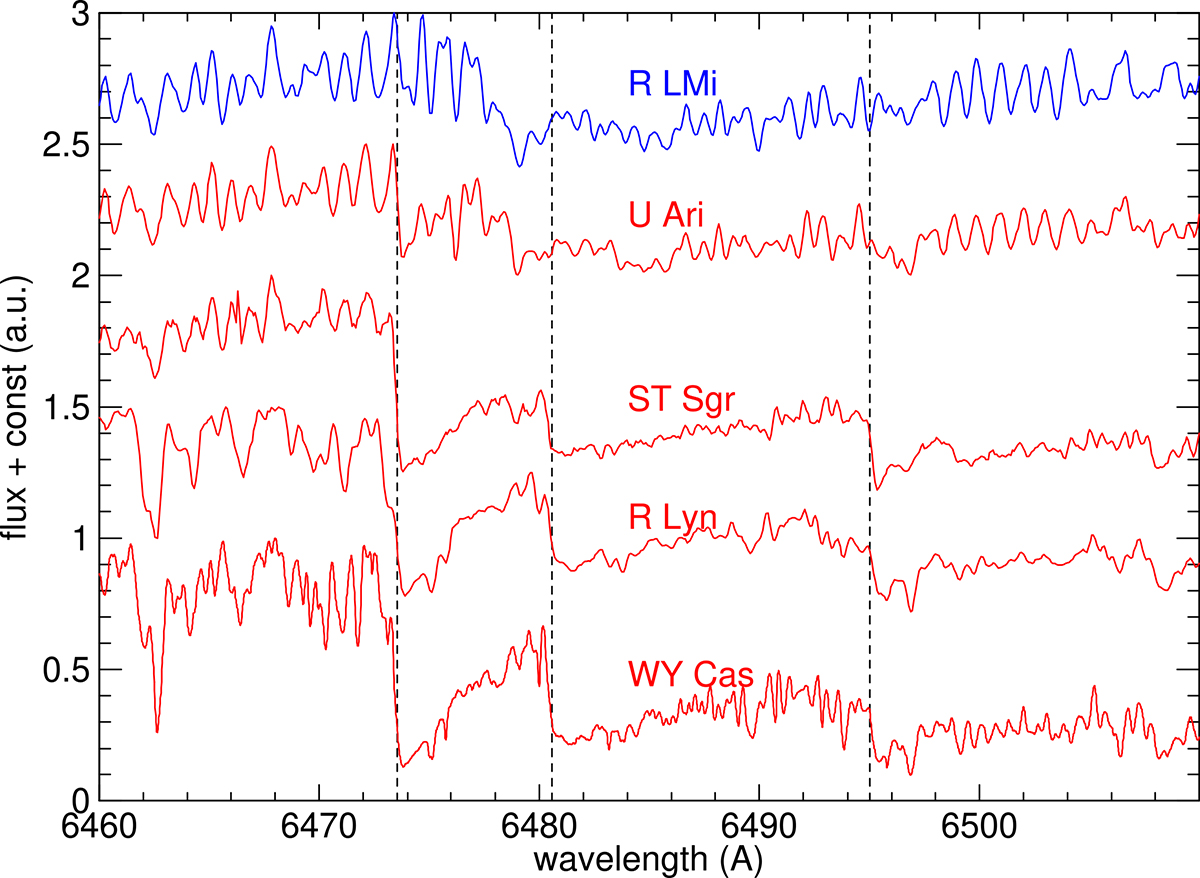
Fig. 2.
Download original image
ZrO band heads of five selected sample stars. The stars from top to bottom are R LMi, U Ari, ST Sgr, R Lyn, and WY Cas. Spectra of Tc-poor stars are plotted as blue and Tc-rich stars as red graphs. For clarity, the spectra are shifted by multiples of 0.5 arbitrary flux units along the y-axis. The wavelengths of ZrO band heads, taken from Davis (1947), are marked by dashed vertical lines. From left to right: ZrO γ(0, 0) Rc (6473.54 Å), γ(0, 0) Xc (6480.57 Å), and γ(1, 1) Rc head (6495.00 Å). ST Sgr is discussed in more detail in Sect. 3.2.
Current usage metrics show cumulative count of Article Views (full-text article views including HTML views, PDF and ePub downloads, according to the available data) and Abstracts Views on Vision4Press platform.
Data correspond to usage on the plateform after 2015. The current usage metrics is available 48-96 hours after online publication and is updated daily on week days.
Initial download of the metrics may take a while.