Fig. 1.
Download original image
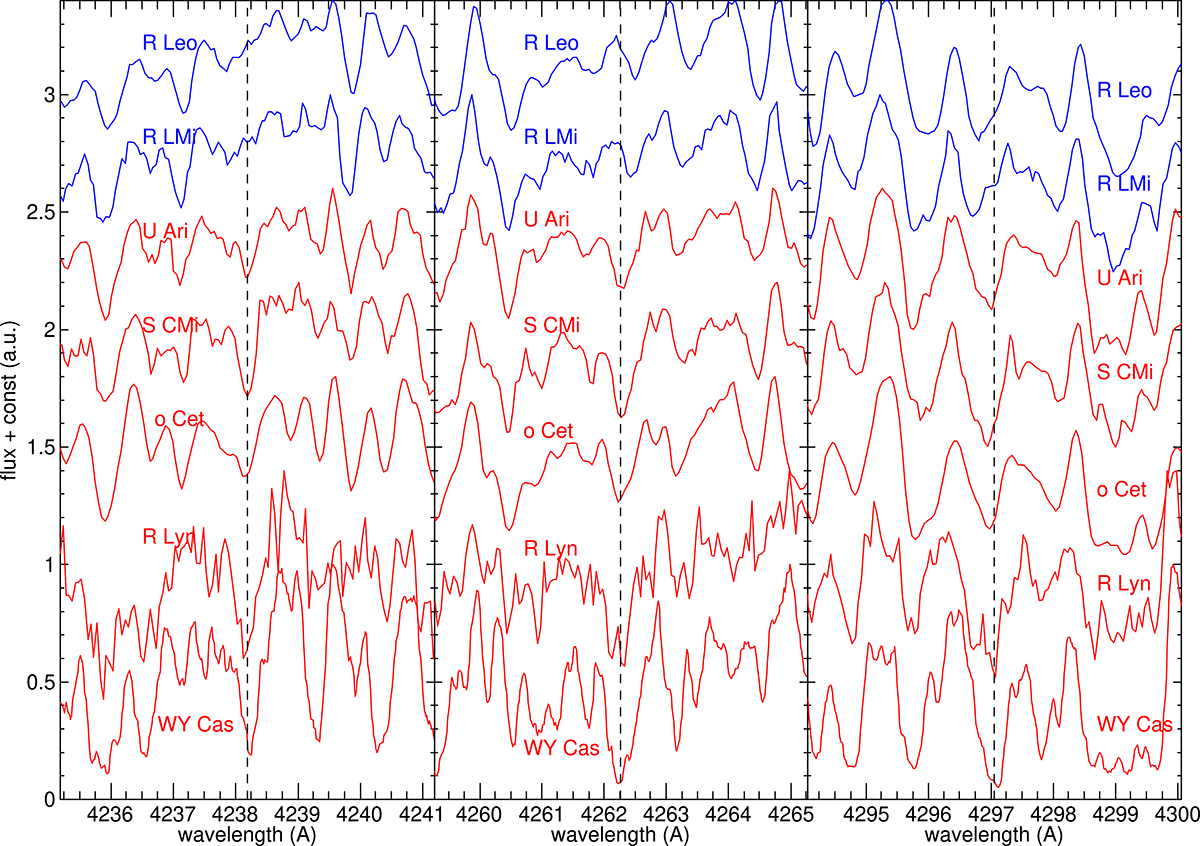
Illustration of the Tc lines in a selection of stars. Left panel: 4238.191 Å Tc I line. Middle panel: 4262.270 Å Tc I line. Right panel: 4297.058 Å Tc I line. A dashed vertical line at each panel centre marks the laboratory wavelength of the Tc transitions. The stars from top to bottom are R Leo, R LMi, U Ari, S CMi, o Cet, R Lyn, and WY Cas. Spectra of stars classified as Tc-poor are plotted as blue graphs, and those classified as Tc-rich as red graphs. For clarity, the spectra are shifted by multiples of 0.4 arbitrary flux units along the y-axis.
Current usage metrics show cumulative count of Article Views (full-text article views including HTML views, PDF and ePub downloads, according to the available data) and Abstracts Views on Vision4Press platform.
Data correspond to usage on the plateform after 2015. The current usage metrics is available 48-96 hours after online publication and is updated daily on week days.
Initial download of the metrics may take a while.