Fig. 6
Download original image
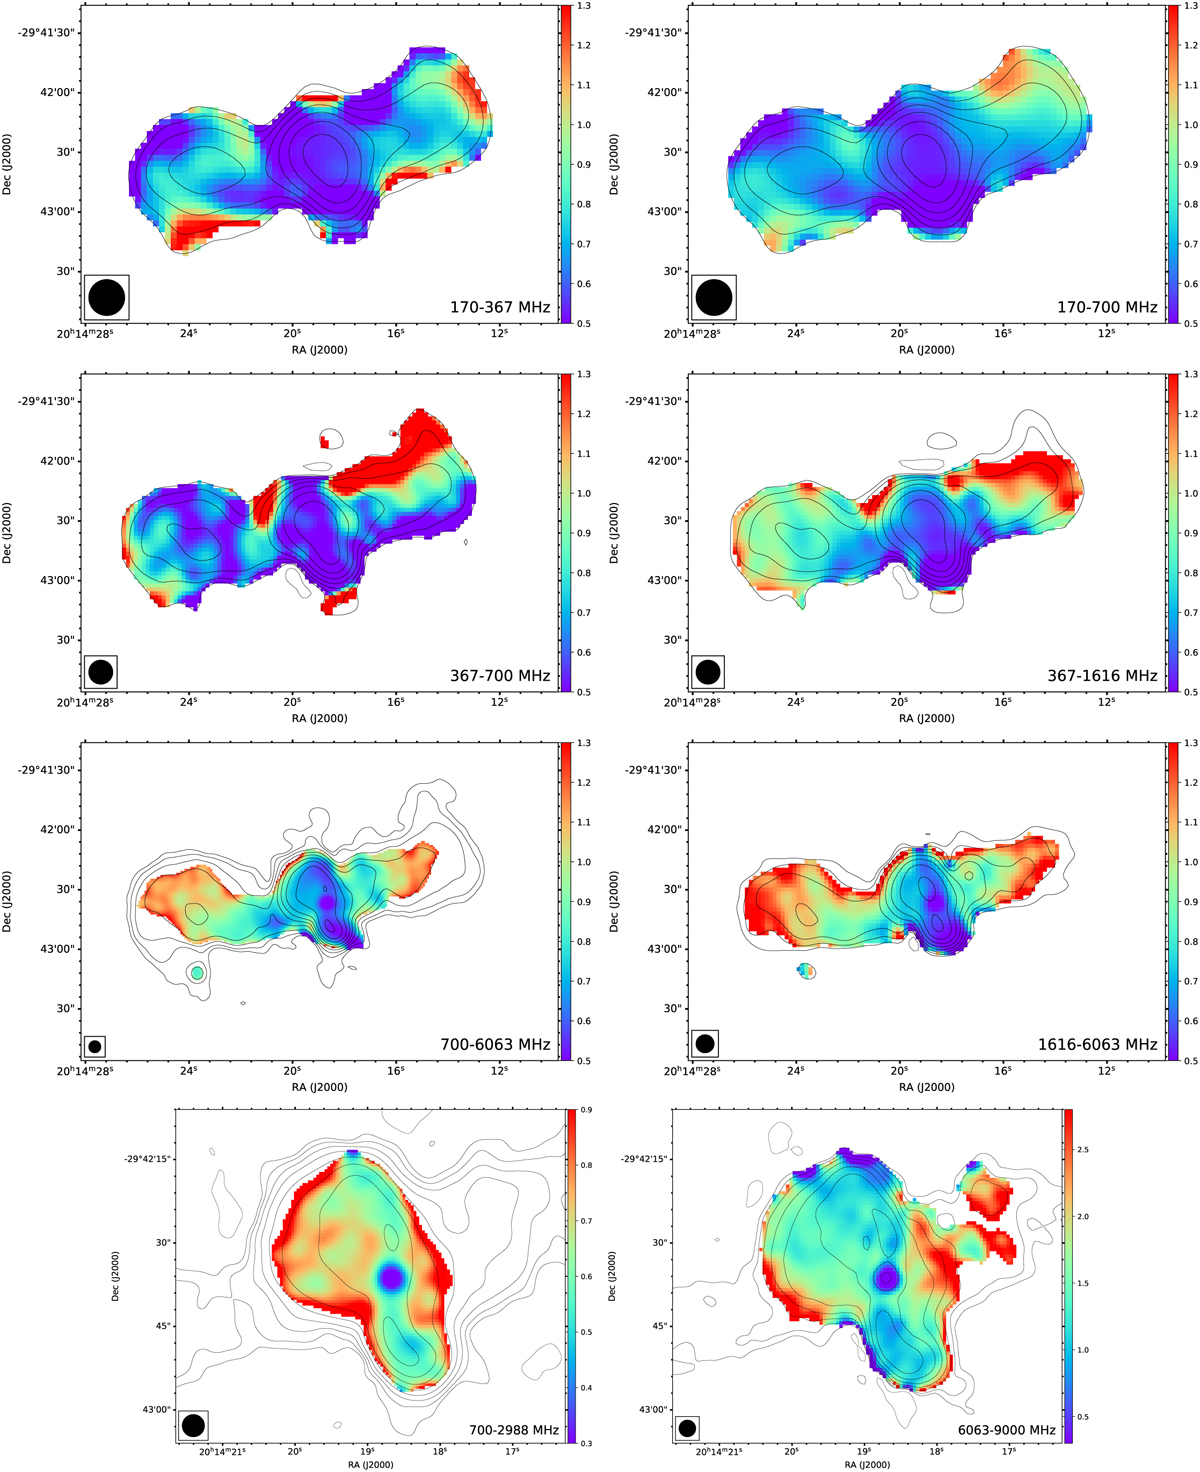
Spectral index maps of MRC 2011-298 for different frequency pairs and resolution. The overlaid contour levels are [±5, 10, 20, 40, ...] × σ from the lower frequency image. From top left to bottom right: 170–367 MHz map at 18″, 170–700 MHz map at 18″, 367–700 MHz map at 12″, 367–1616 MHz map at 12″, 700–6063 MHz map at 6″, 1616–6063 MHz map at 9″, 700–2988 MHz map at 4″, and 6063–9000 MHz map at 3″. Corresponding error maps are shown in Fig. B.1.
Current usage metrics show cumulative count of Article Views (full-text article views including HTML views, PDF and ePub downloads, according to the available data) and Abstracts Views on Vision4Press platform.
Data correspond to usage on the plateform after 2015. The current usage metrics is available 48-96 hours after online publication and is updated daily on week days.
Initial download of the metrics may take a while.