Fig. 10
Download original image
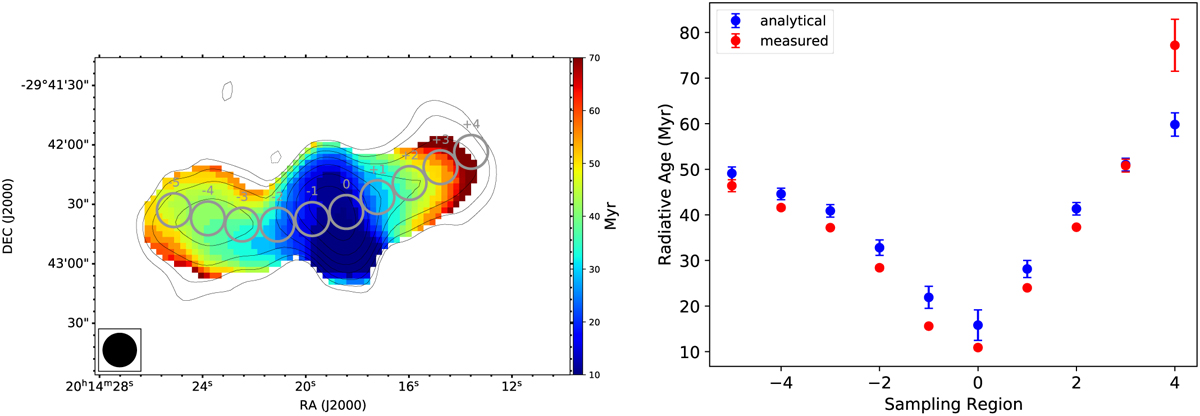
Radiative age of MRC 2011-298 at 17″. Left: Age map computed by fitting 170–700–1616–6063 MHz images with a TJP model (Γ = 0.55, B0 = 2.4 μG). Typical errors are ≲5 Myr. The overlaid contour levels are [±5, 10, 20, 40, ...] × σ from the 170 MHz image. Right: Age profile obtained as the median within the grey circles in the left panel. Red data points are measured from the age map. Blue data points are obtained through Eq. (5) from the 700–6063 MHz spectral index profile.
Current usage metrics show cumulative count of Article Views (full-text article views including HTML views, PDF and ePub downloads, according to the available data) and Abstracts Views on Vision4Press platform.
Data correspond to usage on the plateform after 2015. The current usage metrics is available 48-96 hours after online publication and is updated daily on week days.
Initial download of the metrics may take a while.