Fig. 8.
Download original image
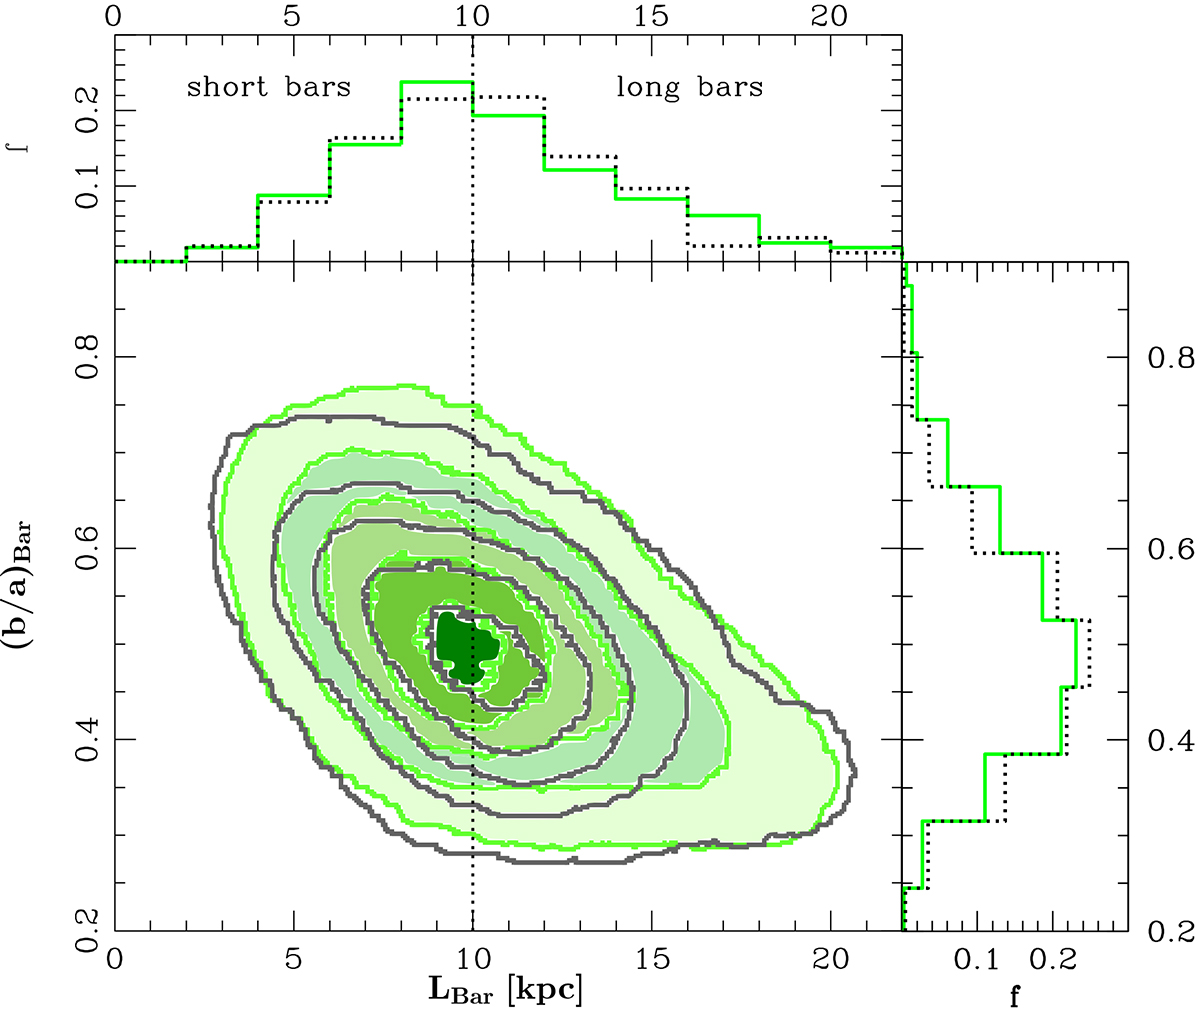
Projected bar axis ratio, (b/a)Bar, as a function of the physical size of bars, LBar, for barred AGN galaxies in pair systems (represented by green contours) and barred AGNs in the control sample (represented by gray contours). The upper and right panels illustrate the normalized distributions of LBar and (b/a)Bar, respectively, for each sample. The dotted vertical black line marks the mean value of LBar, used to divide the sample into two categories, galaxies with short and long bars.
Current usage metrics show cumulative count of Article Views (full-text article views including HTML views, PDF and ePub downloads, according to the available data) and Abstracts Views on Vision4Press platform.
Data correspond to usage on the plateform after 2015. The current usage metrics is available 48-96 hours after online publication and is updated daily on week days.
Initial download of the metrics may take a while.