Open Access
Fig. 6
Download original image
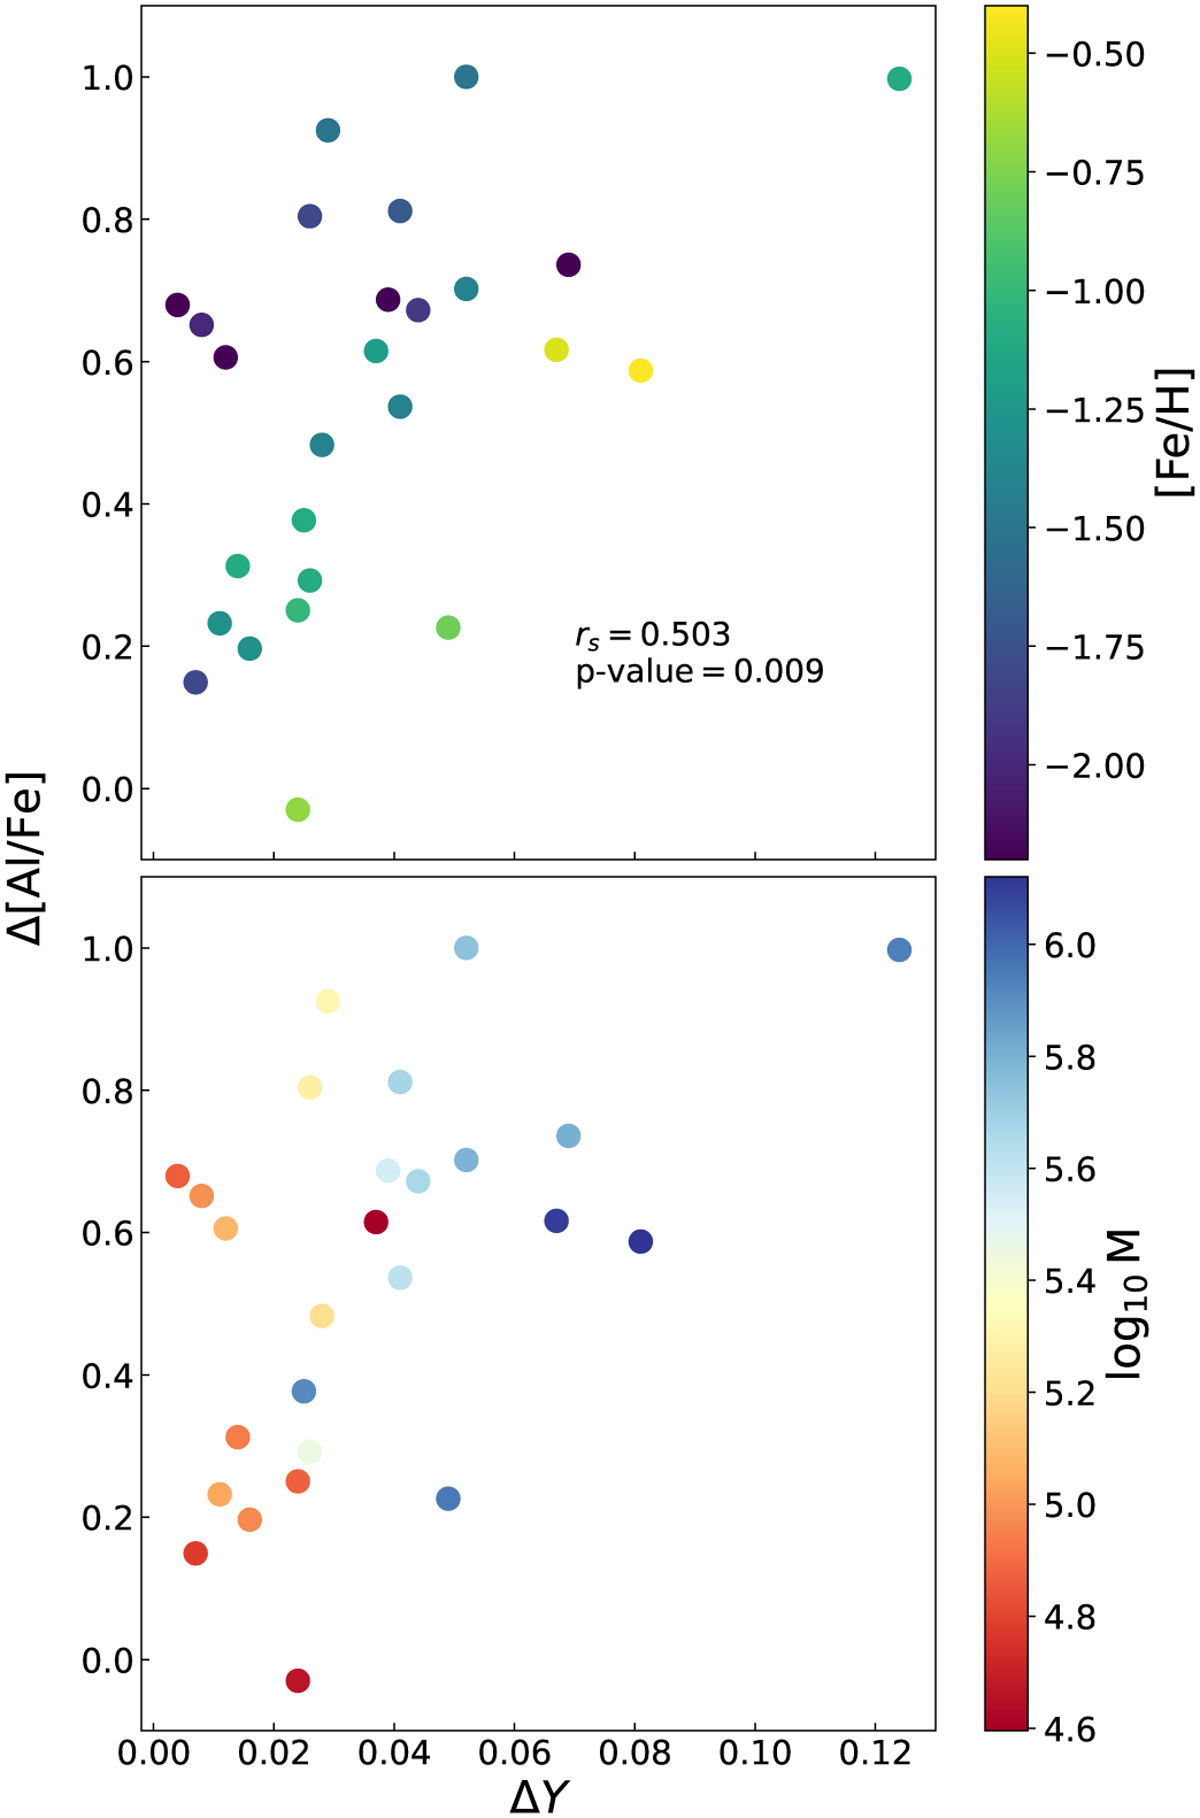
Horizontal axis showing ΔY of a given cluster, while the vertical axis shows Δ[Al/Fe] in accordance with equation (3). The values rs and p are Spearman’s correlation coefficient and its p-value respectively. Top: the color bar shows the cluster’s average metallicity. Bottom: the color bar shows the cluster’s mass in M⊙.
Current usage metrics show cumulative count of Article Views (full-text article views including HTML views, PDF and ePub downloads, according to the available data) and Abstracts Views on Vision4Press platform.
Data correspond to usage on the plateform after 2015. The current usage metrics is available 48-96 hours after online publication and is updated daily on week days.
Initial download of the metrics may take a while.