Fig. 1
Download original image
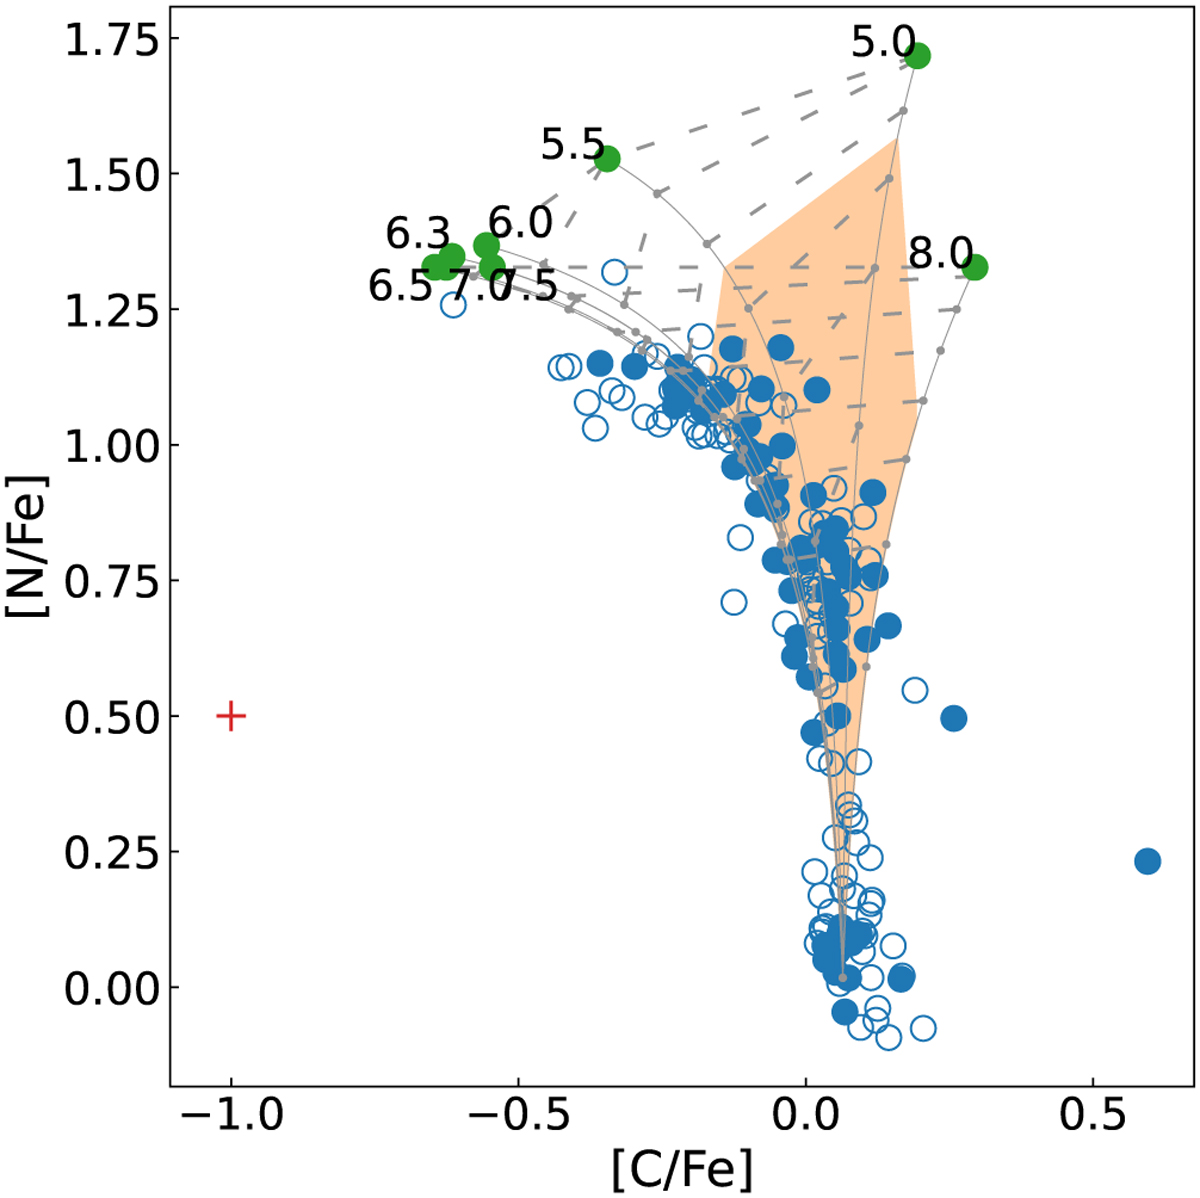
Comparison of the observed [N/Fe] and [C/Fe] abundances in NGC 104 stars with the polluter yields for the AGB scenario. The blue circles correspond to the stars in NGC 104. The filled circles indicate that the star is present in both the APOGEE and the Carretta et al. (2009a,b) datasets, the empty ones indicate that it is present in only one of the datasets. The green circles represent the yields of AGB stars of different masses, labeled with the mass of the parent star in solar masses. Solid gray lines mark the dilution sequence, with the upper and lower ends of f = 0 (undiluted) and f = 1 (fully diluted), respectively. Dashed gray lines connect the points of the dilution curves with the same Y, starting at Y = 0.25 at the bottom and increasing in nine equally spaced steps toward the top of the plot. The maximum spread of He is by the orange shaded region. It represents the range of He values of the cluster’s stars; all stars in the cluster should fill this region for the scenario to correctly predict the observations. The red error bars show the mean uncertainty of the measured abundances.
Current usage metrics show cumulative count of Article Views (full-text article views including HTML views, PDF and ePub downloads, according to the available data) and Abstracts Views on Vision4Press platform.
Data correspond to usage on the plateform after 2015. The current usage metrics is available 48-96 hours after online publication and is updated daily on week days.
Initial download of the metrics may take a while.