Fig. 8
Download original image
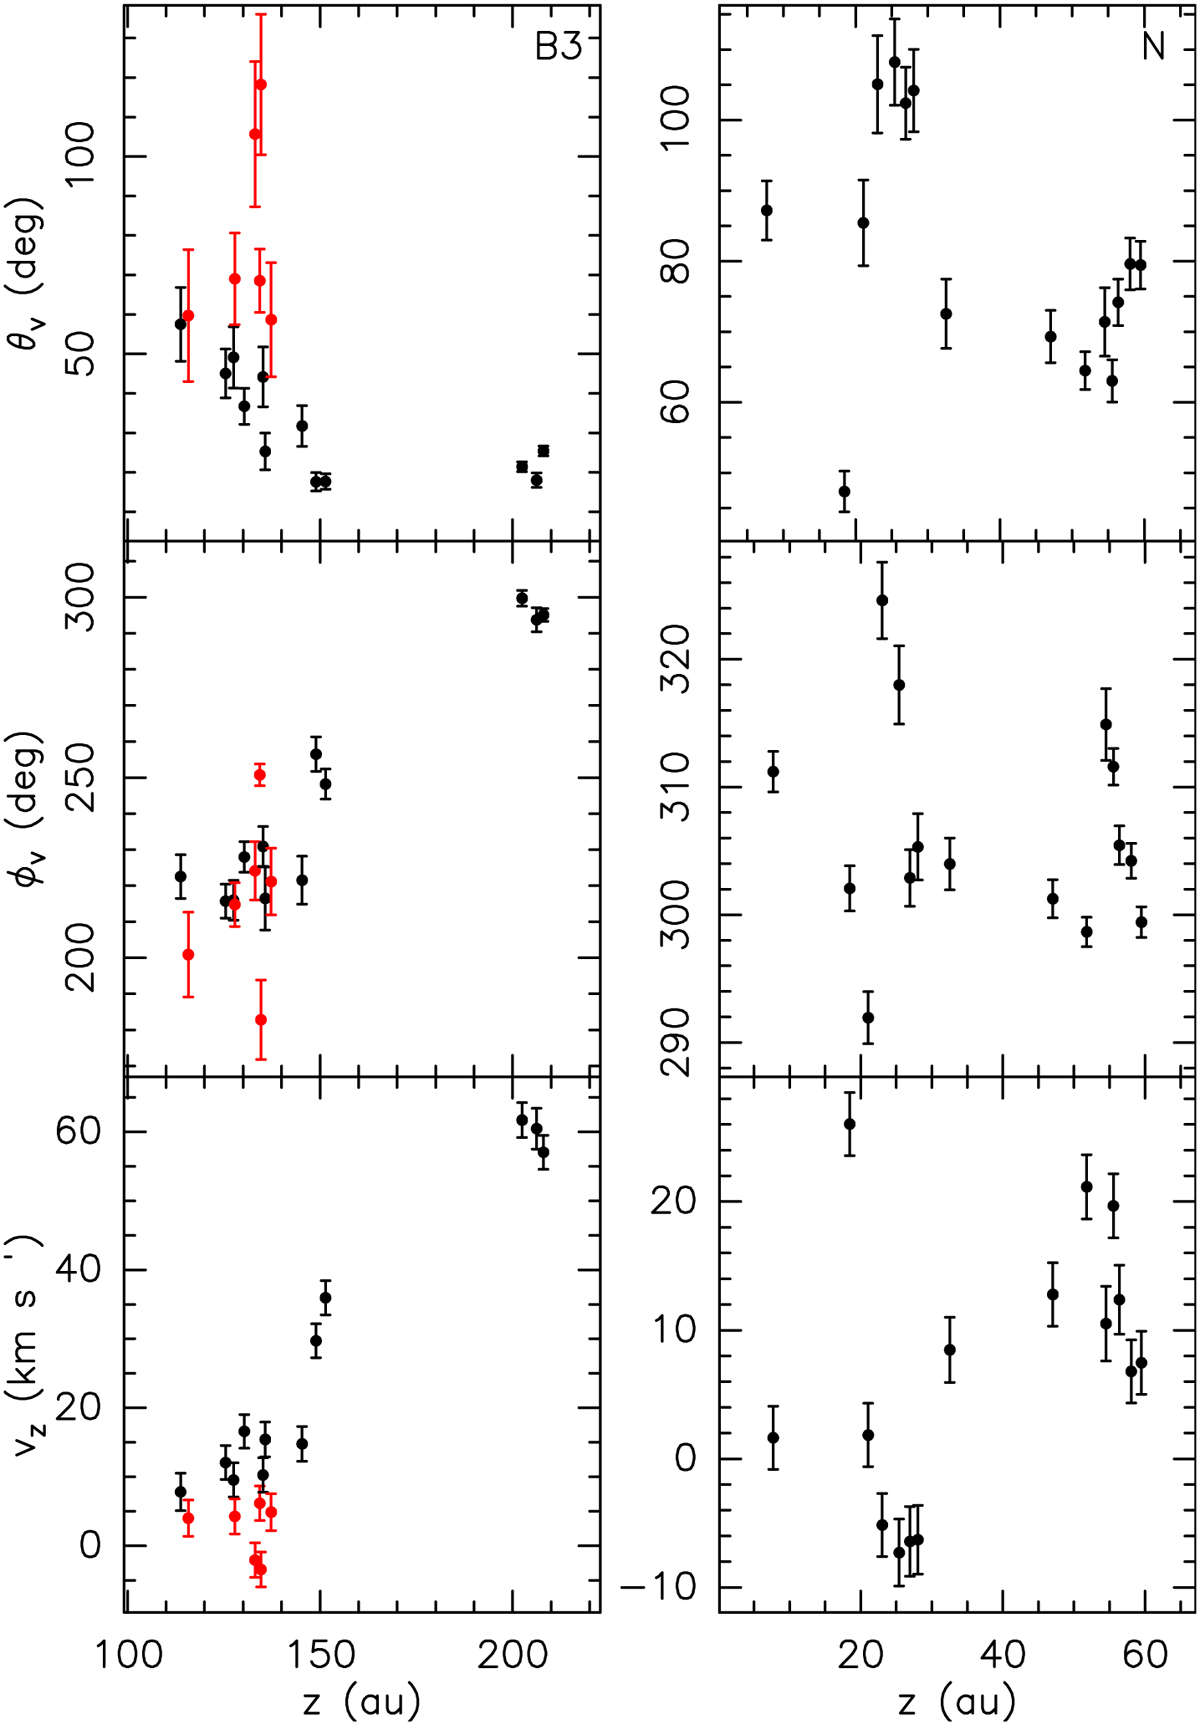
Change in the maser velocity direction and amplitude moving along the jet axis. The left and right panels refer to the B3 stream and N region, respectively. The inclination, θ, and azimuthal, ϕ, angles of the direction of the velocity (see Fig. 2c) and the velocity component along the jet, vɀ, are plotted versus the position along the jet, ɀ, in the top, middle, and bottom panels, respectively. Values and corresponding errors are denoted with dots and error bars, respectively, where red marks velocities ≲6 km s−1 in the B3 stream.
Current usage metrics show cumulative count of Article Views (full-text article views including HTML views, PDF and ePub downloads, according to the available data) and Abstracts Views on Vision4Press platform.
Data correspond to usage on the plateform after 2015. The current usage metrics is available 48-96 hours after online publication and is updated daily on week days.
Initial download of the metrics may take a while.