Fig. 5
Download original image
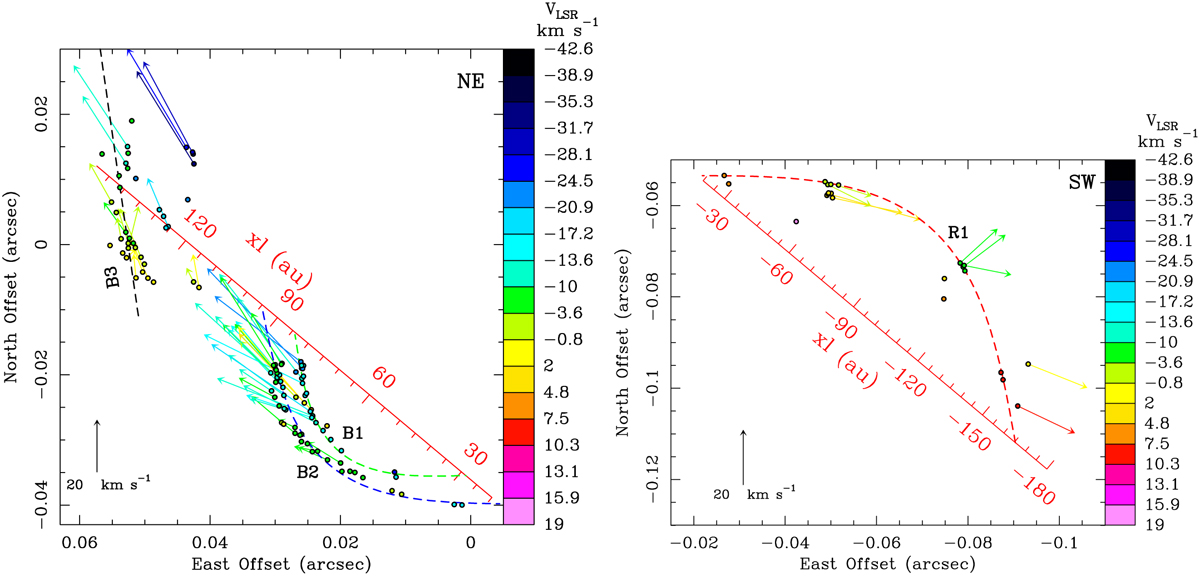
Three-dimensional velocities along the maser streamlines. The colored dots and arrows and the red axes have the same meaning as in Fig. 3. (Left panel) Expanding view of maser positions and proper motions in the NE region. The green and blue dashed curves are the fitted sinusoids to the B1 and B2 streamlines, respectively, whose parameters are reported in Table 2. (Right panel) Expanding view of maser positions and proper motions in the SW region. The red dashed curve is the fitted sinusoid to the R1 streamline, whose parameters are reported in Table 2.
Current usage metrics show cumulative count of Article Views (full-text article views including HTML views, PDF and ePub downloads, according to the available data) and Abstracts Views on Vision4Press platform.
Data correspond to usage on the plateform after 2015. The current usage metrics is available 48-96 hours after online publication and is updated daily on week days.
Initial download of the metrics may take a while.