Fig. B.3
Download original image
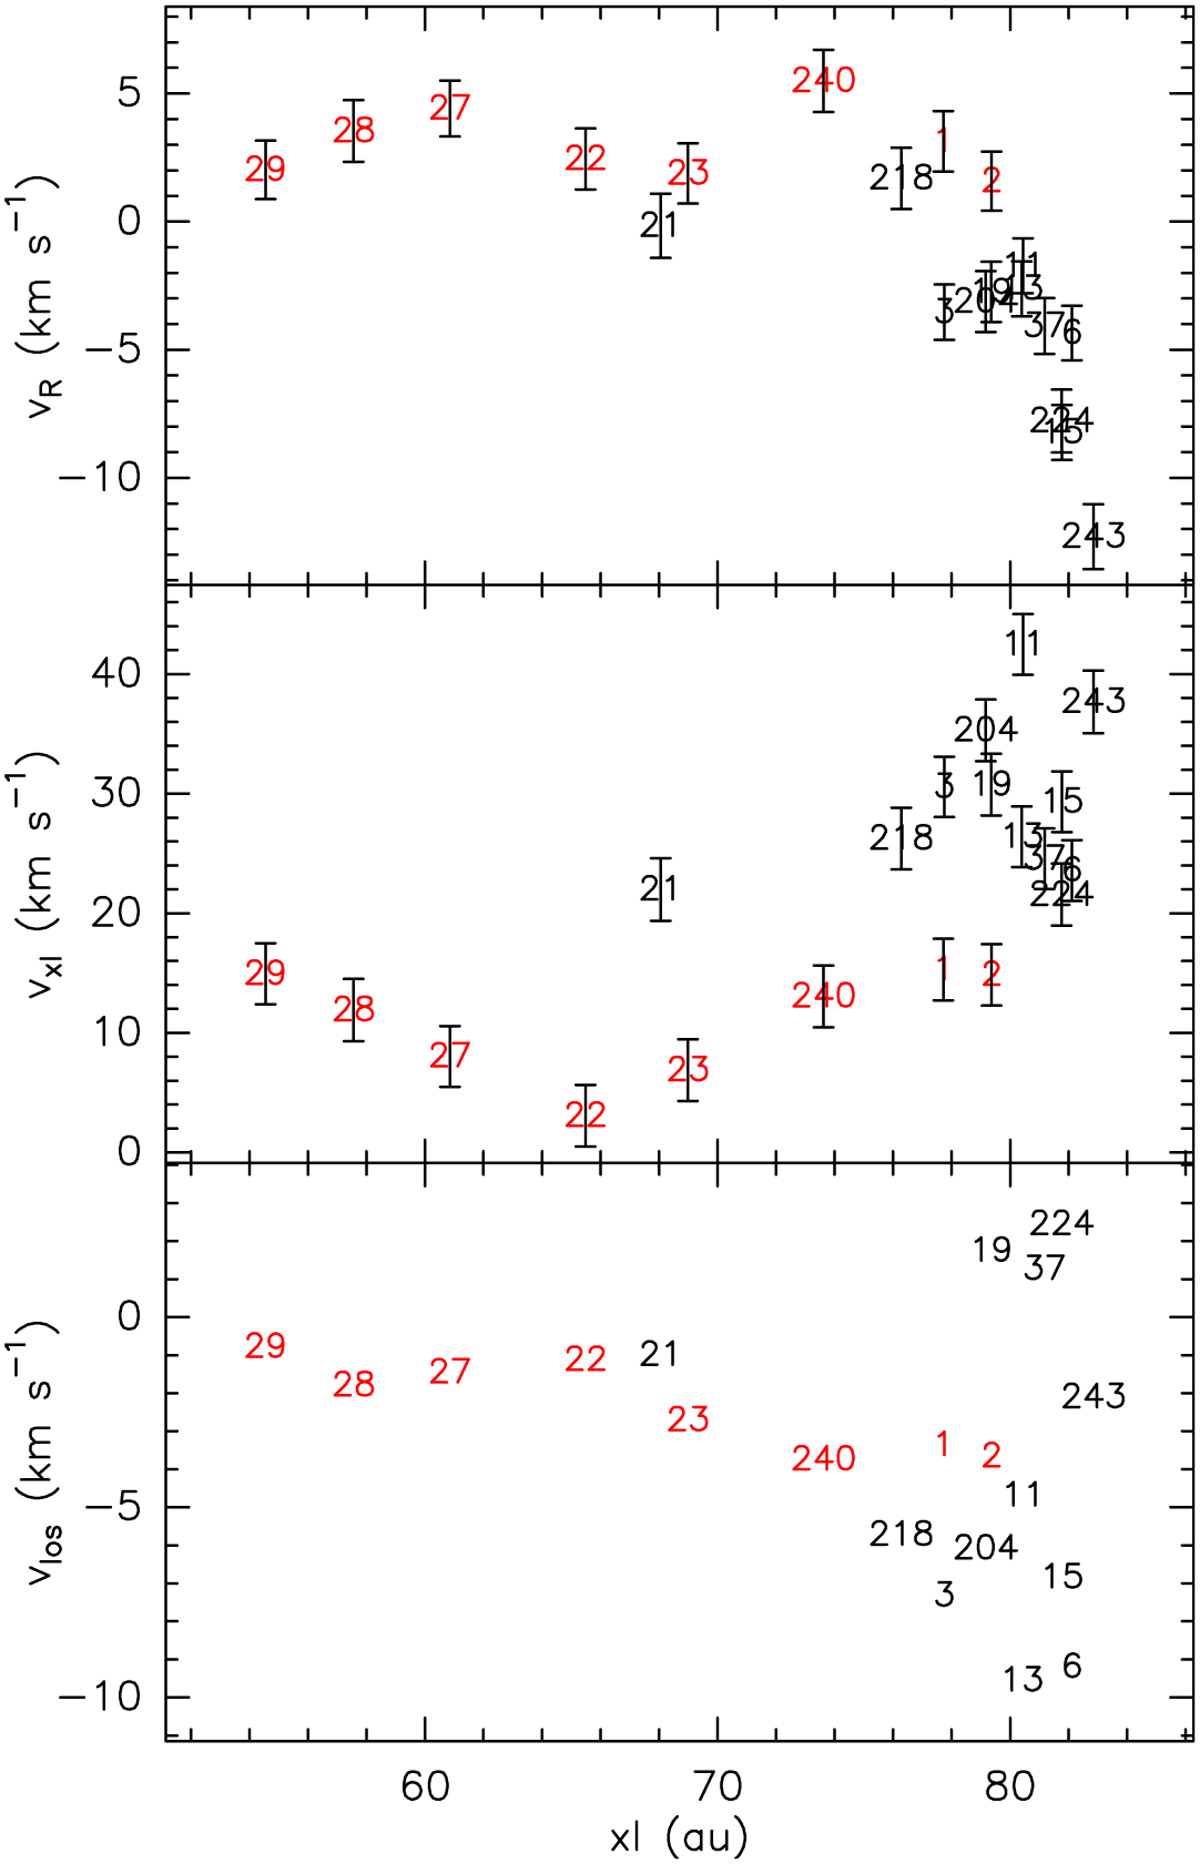
Distribution of velocities in the B2 stream. Maser labels (see Table 1) and error bars report values and corresponding errors for the velocity components along the R (upper panel), xl (middle panel) and los (lower panel) axes. The error bars of the los components are not shown, as they are smaller than the labels. Red labels denote a subset of masers with similar velocity components.
Current usage metrics show cumulative count of Article Views (full-text article views including HTML views, PDF and ePub downloads, according to the available data) and Abstracts Views on Vision4Press platform.
Data correspond to usage on the plateform after 2015. The current usage metrics is available 48-96 hours after online publication and is updated daily on week days.
Initial download of the metrics may take a while.