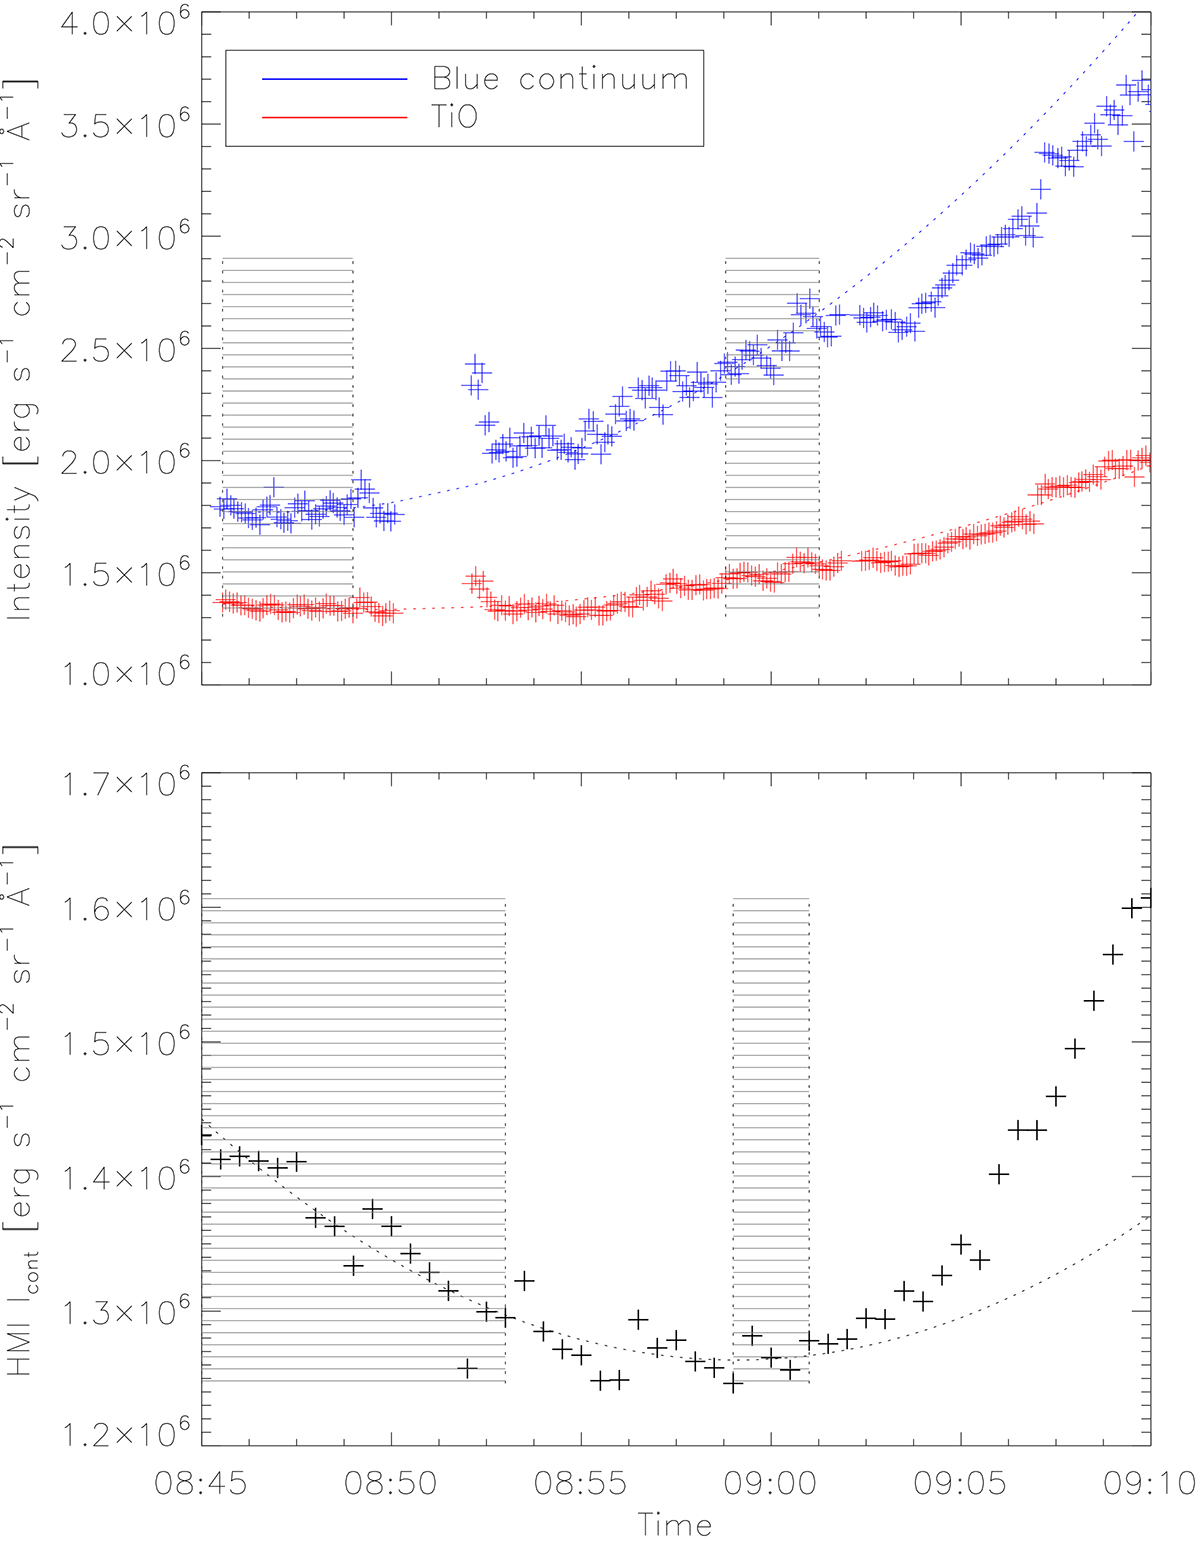
Fig. 6.
Download original image
Evolution of the signal in GREGOR/HiFI+ filters (upper panel, blue line indicates the blue continuum at 450.6 nm and red the TiO band) and the far wings of the Fe I 6173 Å line from SDO/HMI (lower panel). The crosses indicate the measured signal in a pixel co-spatial with pixel No. 53 on the IRIS slit. The dotted line indicates the fitted background, which represents the smooth evolution in the quieter period. The dashed regions indicate the time ranges used for the fitting of the smooth background.
Current usage metrics show cumulative count of Article Views (full-text article views including HTML views, PDF and ePub downloads, according to the available data) and Abstracts Views on Vision4Press platform.
Data correspond to usage on the plateform after 2015. The current usage metrics is available 48-96 hours after online publication and is updated daily on week days.
Initial download of the metrics may take a while.