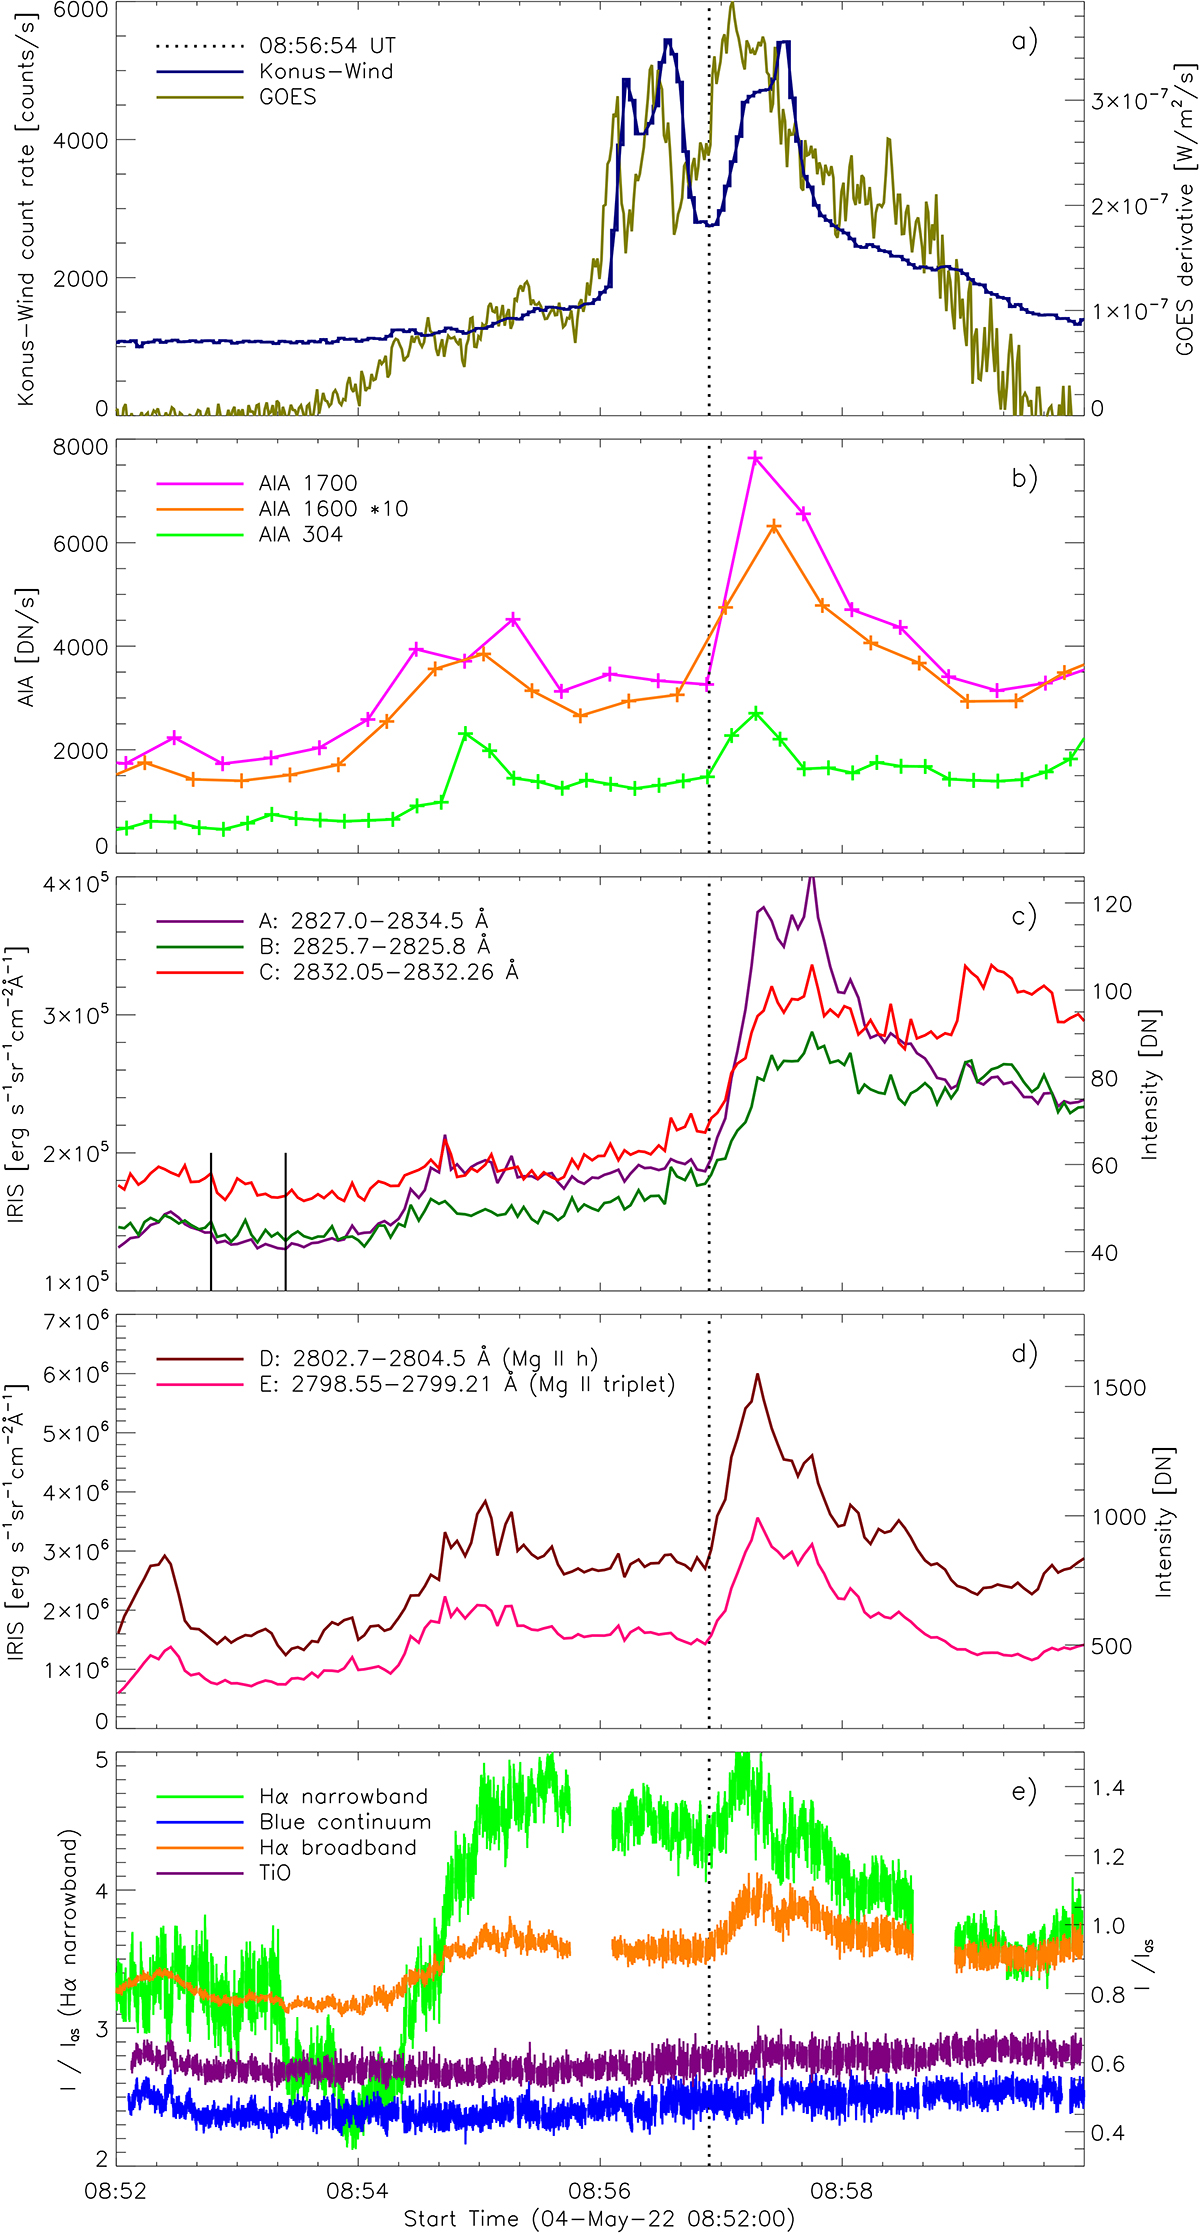
Fig. 5.
Download original image
Light curves in several wavelength bands corresponding to spatially integrated emission (panel a) and pixels co-spatial with the pixel No. 53 along the IRIS slit (panels b–e). Panel a: Konus count rate in the G1 channel and GOES time derivative. Panel b: Emission in several SDO/AIA filters with the 1600 Å filter data scaled by ten for plotting purposes. Panels c and d: calibrated intensity averaged in the IRIS spectral bands A, B, C (panel c; continuum emission), D, and E (panel d; line emission). Panel e: Emission relative to the quiet-Sun values in several GREGOR HiFI+ filters. The preflare time interval for evaluating the IRIS C band preflare emission is delimited by two solid vertical lines in panel c). The vertical dotted line indicates the start of the last HXR pulse.
Current usage metrics show cumulative count of Article Views (full-text article views including HTML views, PDF and ePub downloads, according to the available data) and Abstracts Views on Vision4Press platform.
Data correspond to usage on the plateform after 2015. The current usage metrics is available 48-96 hours after online publication and is updated daily on week days.
Initial download of the metrics may take a while.