Fig. 3.
Download original image
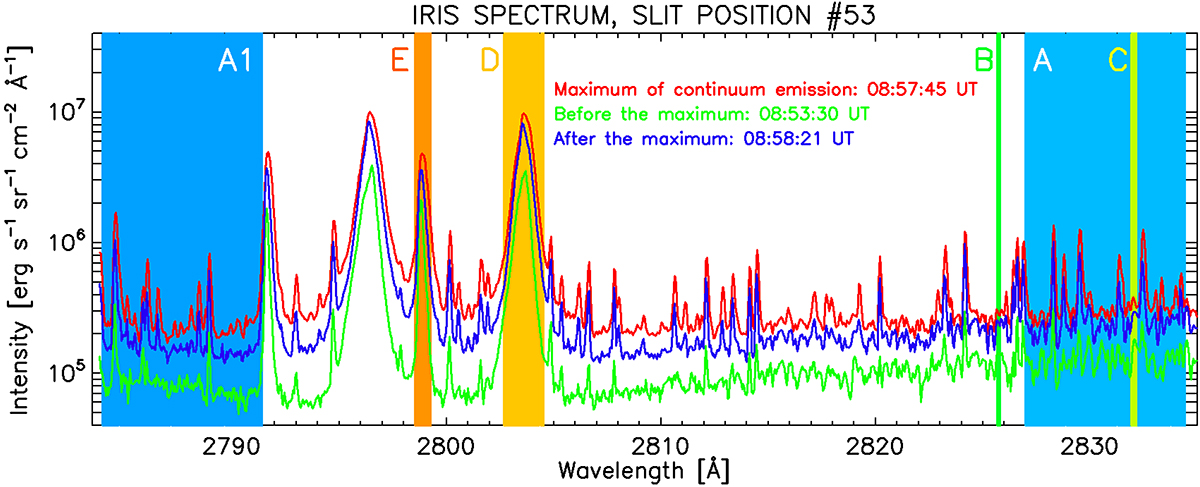
IRIS NUV spectral profiles obtained at the position of the flare kernel (pixel No. 53 along the IRIS slit). The three curves represent the spectrum at the time of maximum enhancement of the continuum emission at 08:57:45 UT (red curve) and at times before and after the maximum (green and blue curves respectively). With different colours (see description in Fig. 2), we mark the spectral ranges A–E. We also marked the A1 range used in Joshi et al. (2021a) but excluded from our analysis (see the text for details).
Current usage metrics show cumulative count of Article Views (full-text article views including HTML views, PDF and ePub downloads, according to the available data) and Abstracts Views on Vision4Press platform.
Data correspond to usage on the plateform after 2015. The current usage metrics is available 48-96 hours after online publication and is updated daily on week days.
Initial download of the metrics may take a while.