Fig. 2.
Download original image
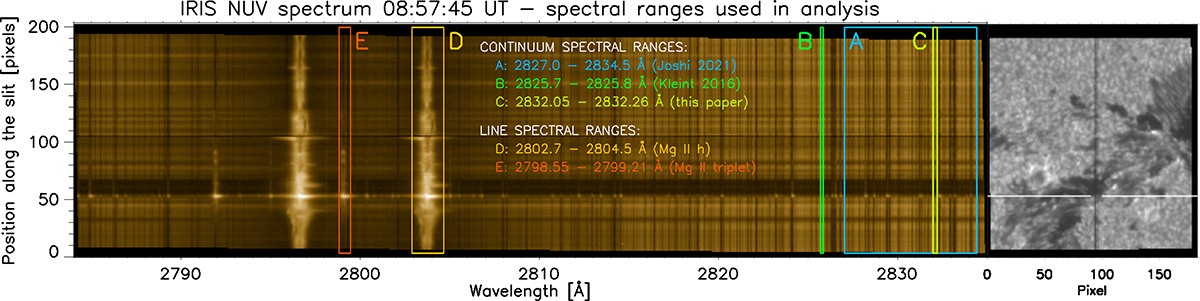
IRIS NUV spectrum recorded at the time of maximum continuum emission (08:57:45 UT) along the full IRIS slit with colour boxes marking the spectral ranges (A, B, C, D, and E) used for the light curve plots and for the continuum analysis. On the right is a synchronous IRIS SJI snapshot with a horizontal white line marking the height of pixel No. 53. Animations of the IRIS data are publicly available here.
Current usage metrics show cumulative count of Article Views (full-text article views including HTML views, PDF and ePub downloads, according to the available data) and Abstracts Views on Vision4Press platform.
Data correspond to usage on the plateform after 2015. The current usage metrics is available 48-96 hours after online publication and is updated daily on week days.
Initial download of the metrics may take a while.