Fig. 1.
Download original image
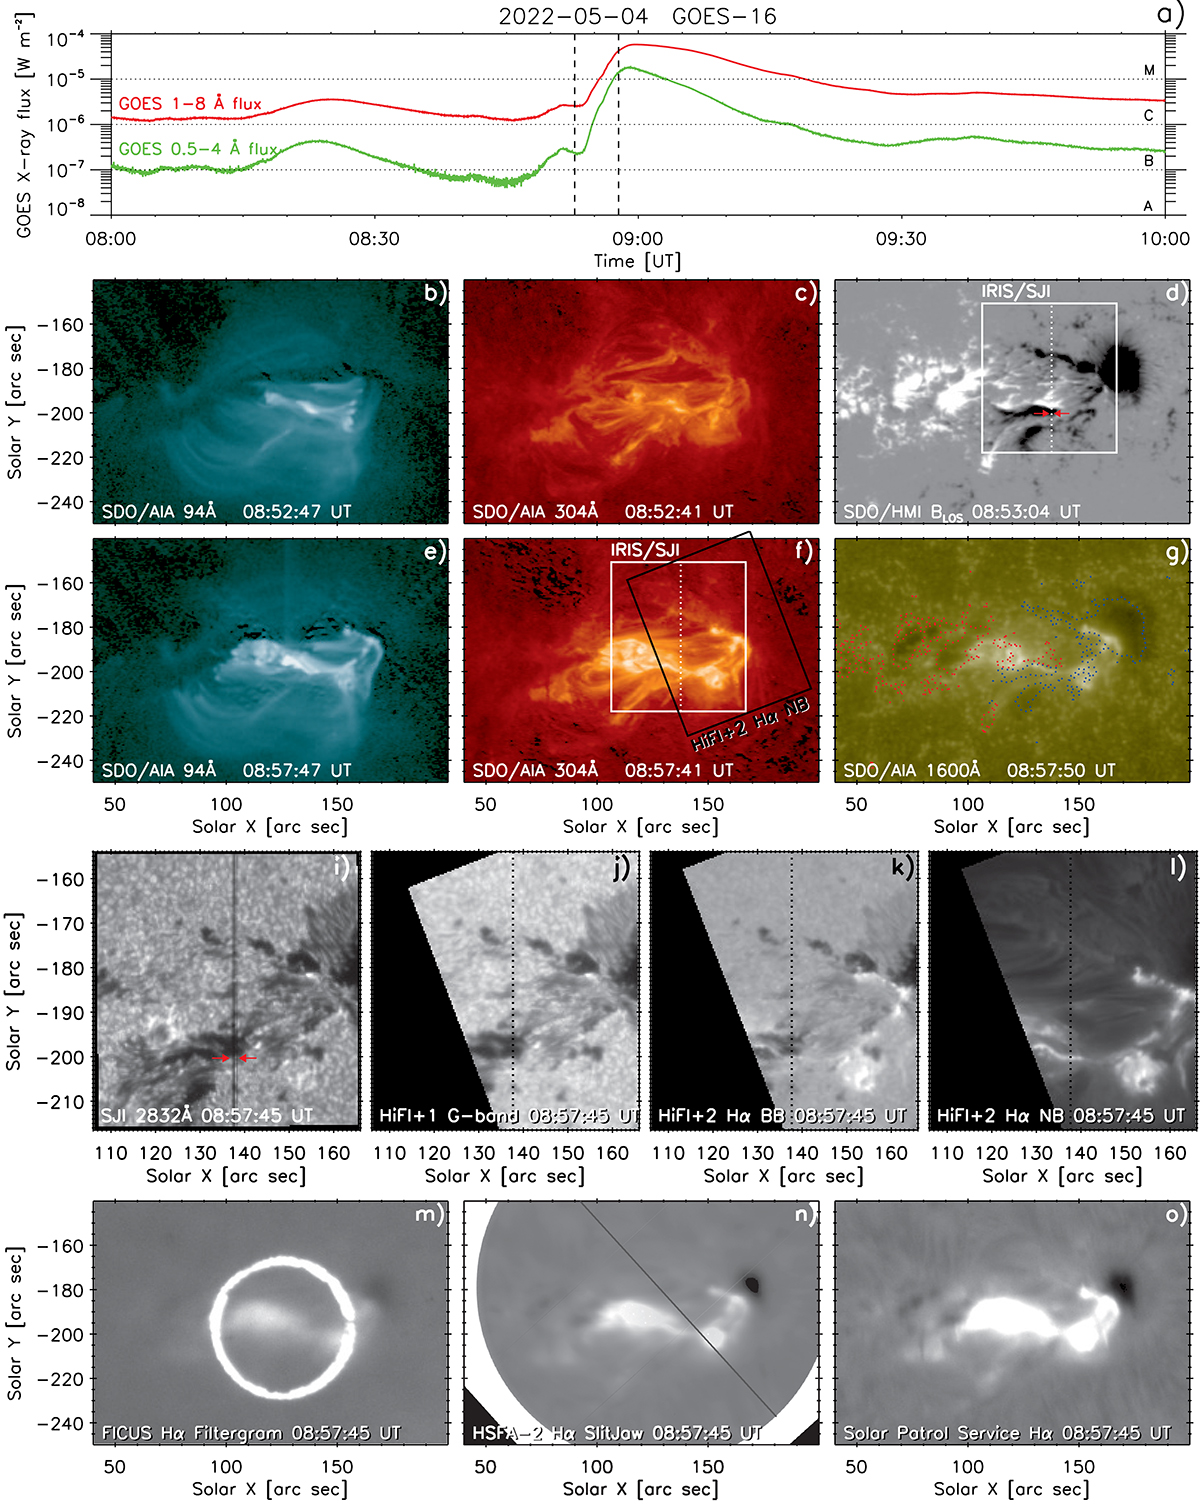
Overview of the 2022 May 4 M5.7–class flare as observed by multiple instruments. Panel a shows the GOES X-ray light curve of the flare. Panels b–g show the context SDO/AIA and SDO/HMI observations at 08:52:45 and 08:57:45 UT, denoted by vertical lines in panel a. Panel g includes the contours of the polarities (positive in red and negative in blue) from panel d. The FOVs of the HiFI+2 and IRIS/SJI instruments are indicated in panel f (only IRIS/SJI FOV in panel d), and the corresponding observations are shown in panels i–l, with the location of the IRIS slit indicated and the HiFI+ images resampled to the IRIS resolution and FOV. The red arrows in panels d and i point to the location of pixel No. 53. Ondřejov ground-based observations from the spectrographs FICUS and HSFA-2 and the SPS are shown in panels m–o, respectively. The black line in panel n indicates the HSFA-2 slit position. Animations of the AIA, IRIS, and GREGOR observations (panels e–l) are available online.
Current usage metrics show cumulative count of Article Views (full-text article views including HTML views, PDF and ePub downloads, according to the available data) and Abstracts Views on Vision4Press platform.
Data correspond to usage on the plateform after 2015. The current usage metrics is available 48-96 hours after online publication and is updated daily on week days.
Initial download of the metrics may take a while.