Fig. 6
Download original image
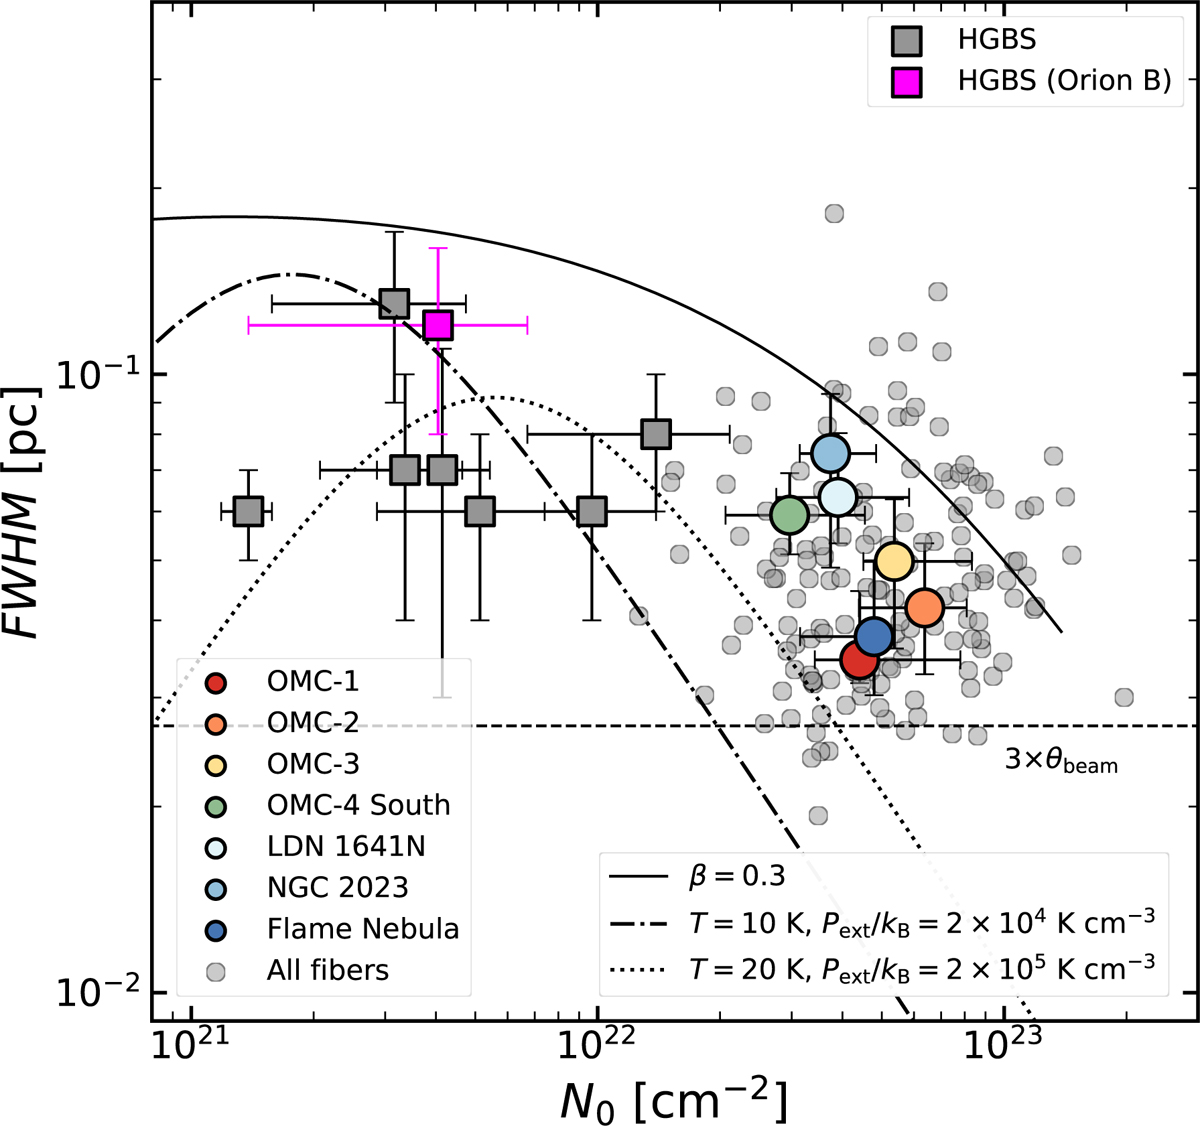
Comparison between the peak column densities (N0) and widths (FWHM) of the fibers in the EMERGE Early ALMA Survey (circles, this work), the Herschel filaments in the HGBS (squares, Arzoumanian et al. 2019). The large circles represent the median widths and densities per region in our survey. The dashed black line indicates the limit for unresolved fibers in our study (3 × θbeam, or 0.027 pc). Different curves denote representative examples of the FWHM − N0 dependence expected in pressure-truncated filaments with (TK,Pext/kB) = (10 K, 2 × 10⁴ K cm−3; dash-dotted line) and (TK,Pext/kB) = (20 K, 2 × 10⁵ K cm−3; dotted line), respectively (Fischera & Martin 2012), as well as those for weakly magnetised filaments (β = 0.3) (Heitsch 2013b).
Current usage metrics show cumulative count of Article Views (full-text article views including HTML views, PDF and ePub downloads, according to the available data) and Abstracts Views on Vision4Press platform.
Data correspond to usage on the plateform after 2015. The current usage metrics is available 48-96 hours after online publication and is updated daily on week days.
Initial download of the metrics may take a while.