Fig. 4
Download original image
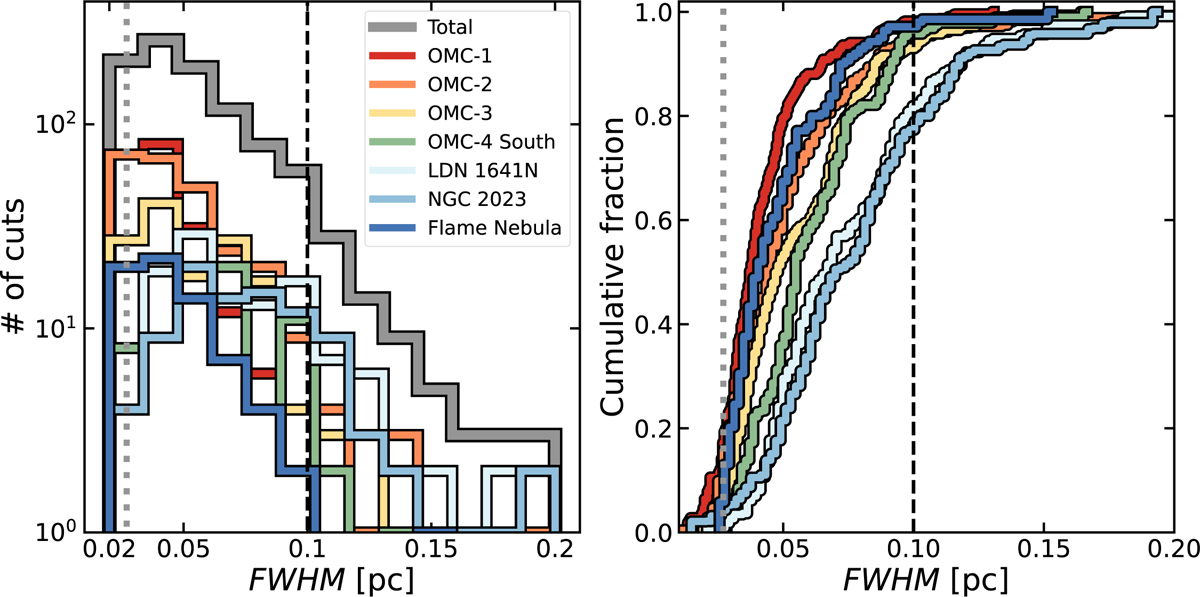
Distribution for the FWHM derived across all the cuts in each fiber radial profile. (Left panel) Histogram of the fiber FWHM divided per region. (Right panel) Cumulative distribution of the same FWHM per fiber cut. The dashed black line in the left panel corresponds to the characteristic FWHM measured in parsec-scale filaments in the Solar neighbourhood (e.g. Arzoumanian et al. 2011) while a dotted grey line indicates the minimum size (3 × θbeam) for our fibers to be considered as resolved by our observations.
Current usage metrics show cumulative count of Article Views (full-text article views including HTML views, PDF and ePub downloads, according to the available data) and Abstracts Views on Vision4Press platform.
Data correspond to usage on the plateform after 2015. The current usage metrics is available 48-96 hours after online publication and is updated daily on week days.
Initial download of the metrics may take a while.