Fig. 3
Download original image
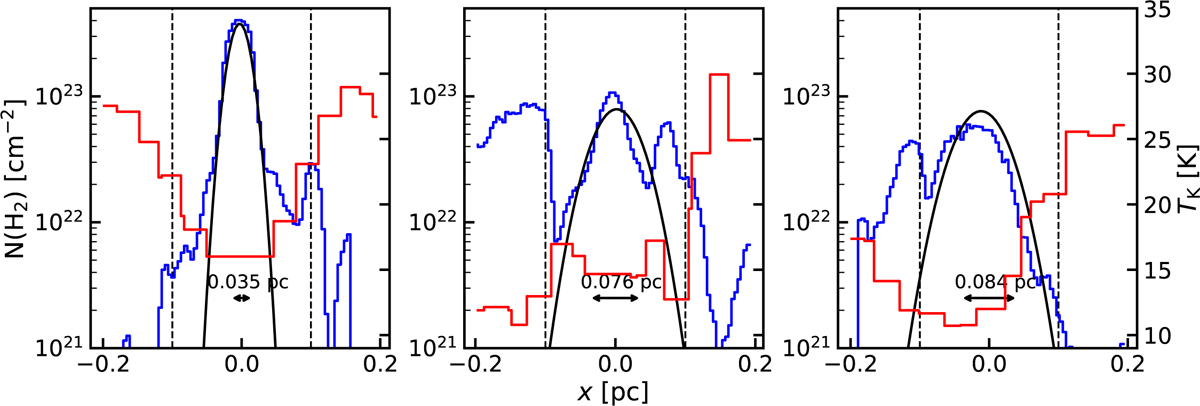
Radial profiles of selected cuts in three fibers belonging to the Flame Nebula (left panel), LDN 1641N (central panel), and NGC 2023 (right panel). Similarly to Fig. 2, we report the distance at which the temperature gradient is determined (dashed black lines) and the FWHMs determined from the best Gaussian fit (solid black line) to the density profile (blue line).
Current usage metrics show cumulative count of Article Views (full-text article views including HTML views, PDF and ePub downloads, according to the available data) and Abstracts Views on Vision4Press platform.
Data correspond to usage on the plateform after 2015. The current usage metrics is available 48-96 hours after online publication and is updated daily on week days.
Initial download of the metrics may take a while.