Fig. 2
Download original image
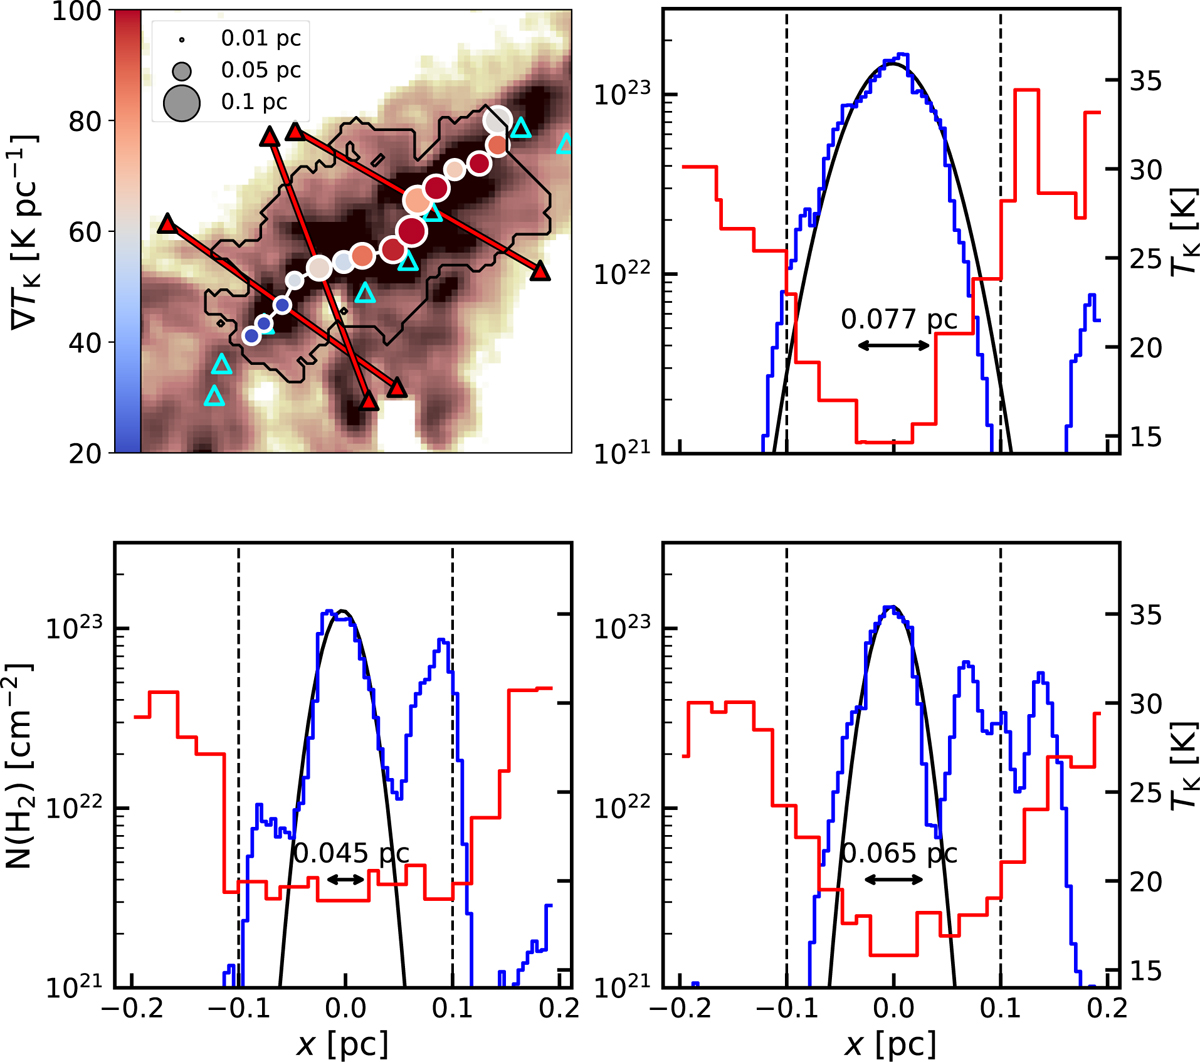
Radial properties measured in fiber #7 in OMC-3 (see also Appendix B). Upper left panel: zoom-in on the N(H2) map presented in Fig. 1. All positions associated with this fiber are enclosed by a black contour. The axis of this fiber #7 is indicated by a white polygon where its knots are colour-coded by the temperature gradient measured through Eq. (8) and their size corresponds to the fiber width measured at this position. Three red lines indicate the orientation and length (~ ± 0.1 pc with respect to the centre of the fiber) of the radial cuts presented in the other panels, up to the dashed lines. Upper right plus lower panels: column density (blue line) and gas kinetic temperature (red line) profiles measured perpendicular to the filament axis (centre). The best Gaussian fit to the column density profile, including its FWHM value, is indicated in each panel (solid black curve).
Current usage metrics show cumulative count of Article Views (full-text article views including HTML views, PDF and ePub downloads, according to the available data) and Abstracts Views on Vision4Press platform.
Data correspond to usage on the plateform after 2015. The current usage metrics is available 48-96 hours after online publication and is updated daily on week days.
Initial download of the metrics may take a while.