Fig. B.1
Download original image
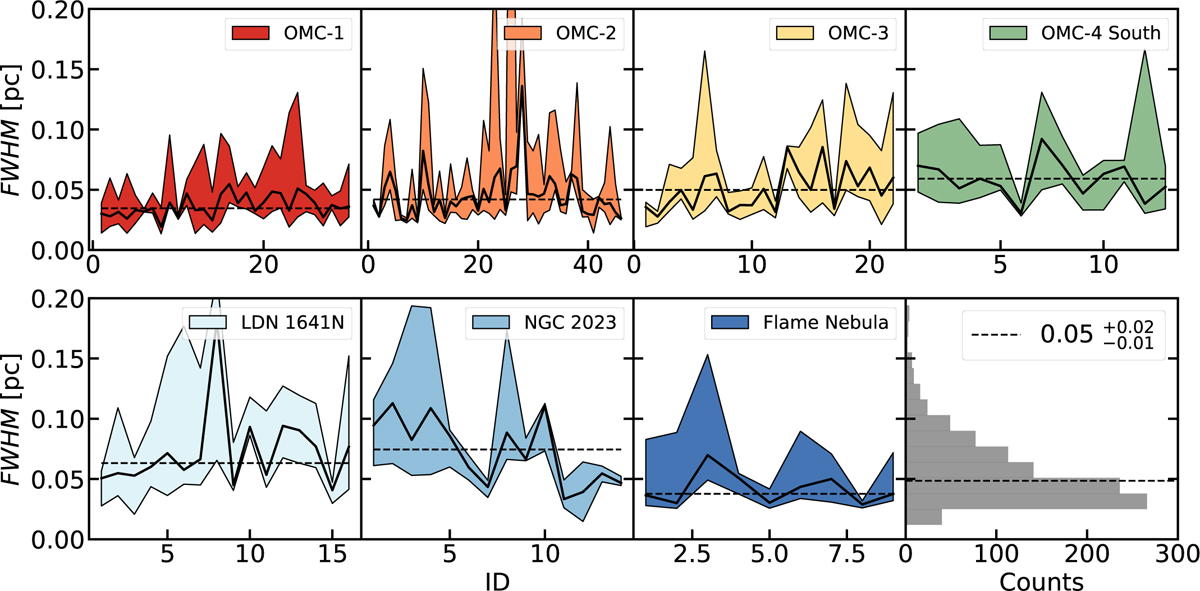
We report here the variation in the width per fiber in each region composing the EMERGE Early ALMA Survey. The fibers are numbered based on their identification number (ID) and we display the range within minimum and maximum width per fiber with colour-coded areas. The solid black lines represent the median width per fiber, while the dashed lines the median width per region (e.g. circles displayed in Fig. 6). The lower rightmost panel shows the distribution of all the 991 cuts fitted in our sample (see also Fig. 4, left panel).
Current usage metrics show cumulative count of Article Views (full-text article views including HTML views, PDF and ePub downloads, according to the available data) and Abstracts Views on Vision4Press platform.
Data correspond to usage on the plateform after 2015. The current usage metrics is available 48-96 hours after online publication and is updated daily on week days.
Initial download of the metrics may take a while.