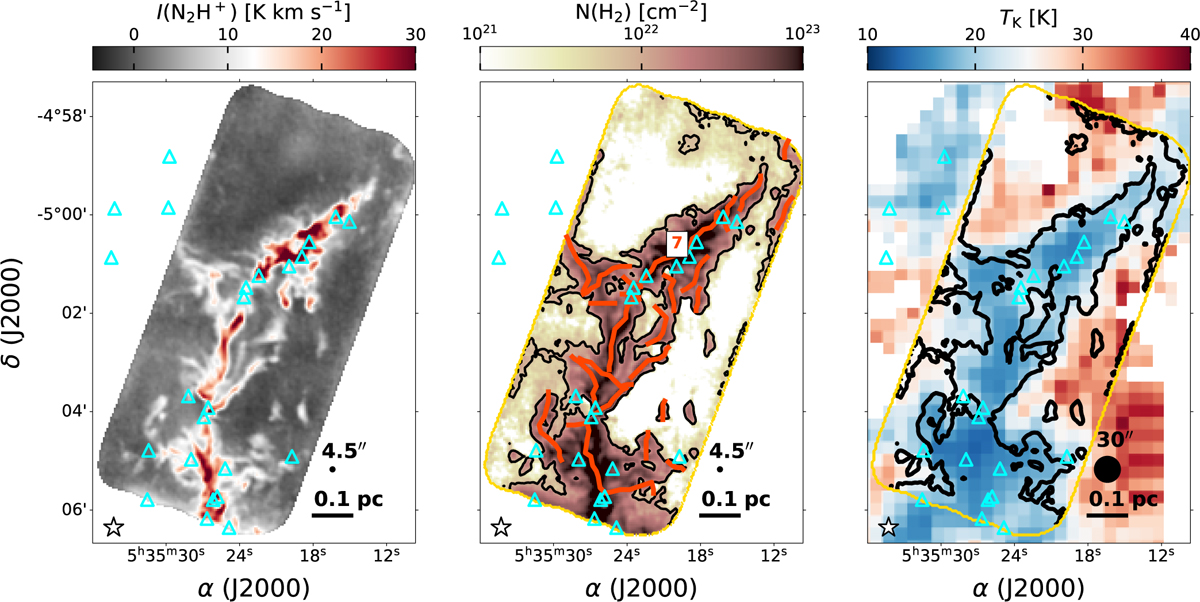
Fig. 1
Download original image
OMC-3 as a showcase for the results obtained from the EMERGE Early ALMA Survey (see Papers I and III for details about these maps). (Left panel) N2H+ (1–0) integrated intensity map at a resolution of 2000 au (or 4.5″) obtained by our ALMA+IRAM-30 m observations. (Central panel) Total column density map of H2 derived at 2000 au resolution. The black contour corresponds to an intensity of N2H+ with S/N = 3. Red lines define the axes of the fibers identified in Paper III where Fiber #7 is highlighted with its ID and further discussed in Sect. 3.1 and Fig. 2. (Right panel) Gas kinetic temperature TK map determined at the IRAM-30m single-dish resolution of ∼12 000 au (or 30″). In all panels, cyan triangles correspond to the protostellar objects (Class 0/I; Megeath et al. 2012; Stutz et al. 2013; Furlan et al. 2016), while the white star corresponds to a B star (gathered from the SIMBAD catalogue; Wenger et al. 2000).
Current usage metrics show cumulative count of Article Views (full-text article views including HTML views, PDF and ePub downloads, according to the available data) and Abstracts Views on Vision4Press platform.
Data correspond to usage on the plateform after 2015. The current usage metrics is available 48-96 hours after online publication and is updated daily on week days.
Initial download of the metrics may take a while.