Fig. 6
Download original image
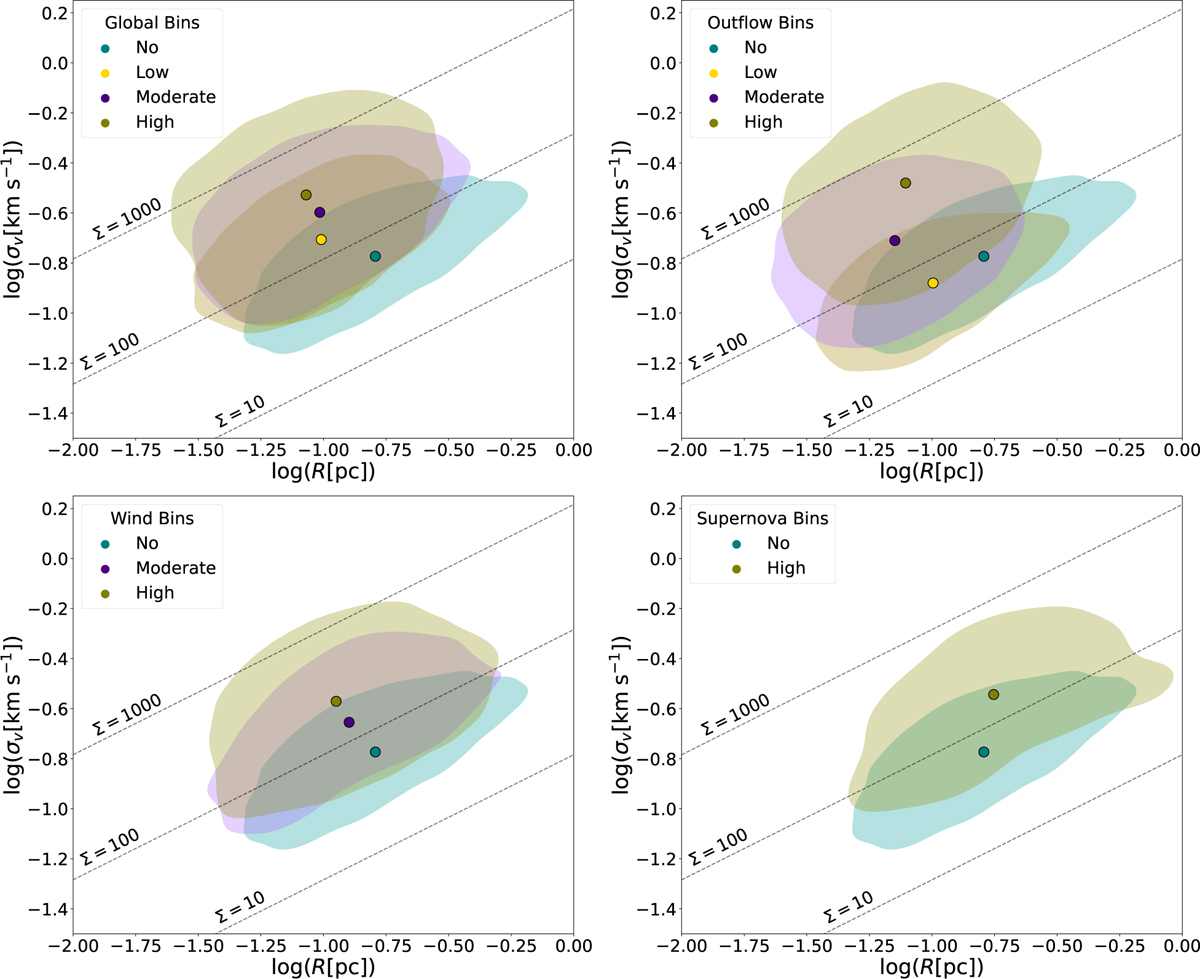
Size-linewidth relation (σv versus R) for cores in different feedback bins. Top left: Distribution in the four global feedback bins. Top right: distributions in the outflow bins. Lower left and lower right: wind and supernova bins, respectively. The dashed lines represent Larson’s first relation (slope of 0.5; Larson 1981; Solomon & Wickramasinghe 1969) for different surface mass densities (units of M⊙ pc−2) for virialised structures (αvir = 1). The different colours represent the distribution of cores in the various feedback bins, as noted in the legend.
Current usage metrics show cumulative count of Article Views (full-text article views including HTML views, PDF and ePub downloads, according to the available data) and Abstracts Views on Vision4Press platform.
Data correspond to usage on the plateform after 2015. The current usage metrics is available 48-96 hours after online publication and is updated daily on week days.
Initial download of the metrics may take a while.