Fig. 4
Download original image
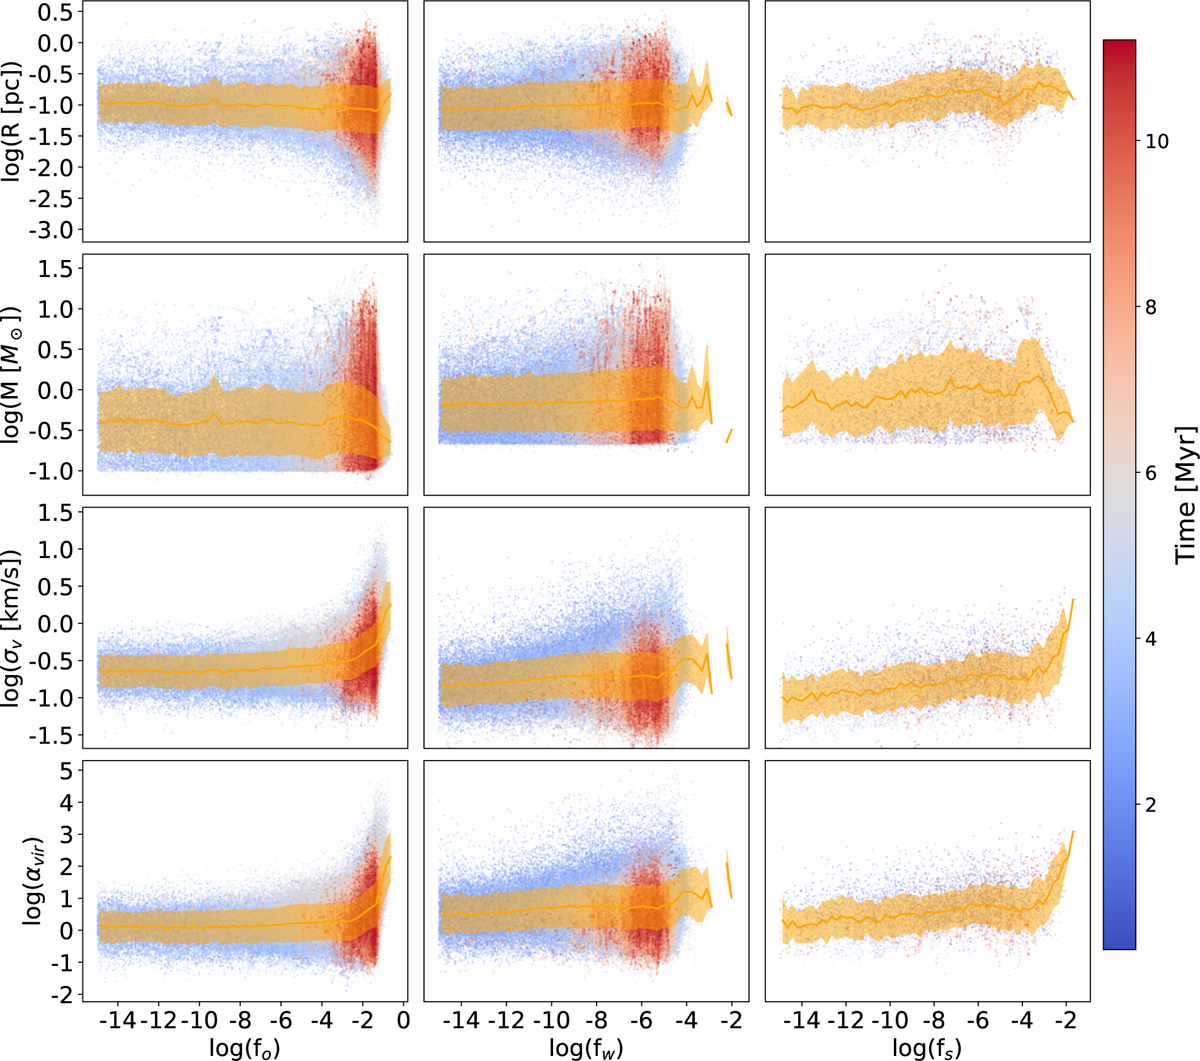
Core properties versus feedback fraction from outflows (left), winds (centre), and supernovae (right). The rows represent the radius of the core, the velocity dispersion, the mass, and the virial parameter, respectively. The orange filled area represents the average distribution of all cores, obtained by binning over the feedback fractions to get the 25th and 75th percentiles. The point colours indicate the simulation time when the core is identified, as time elapsed in Myr.
Current usage metrics show cumulative count of Article Views (full-text article views including HTML views, PDF and ePub downloads, according to the available data) and Abstracts Views on Vision4Press platform.
Data correspond to usage on the plateform after 2015. The current usage metrics is available 48-96 hours after online publication and is updated daily on week days.
Initial download of the metrics may take a while.