Fig. 3
Download original image
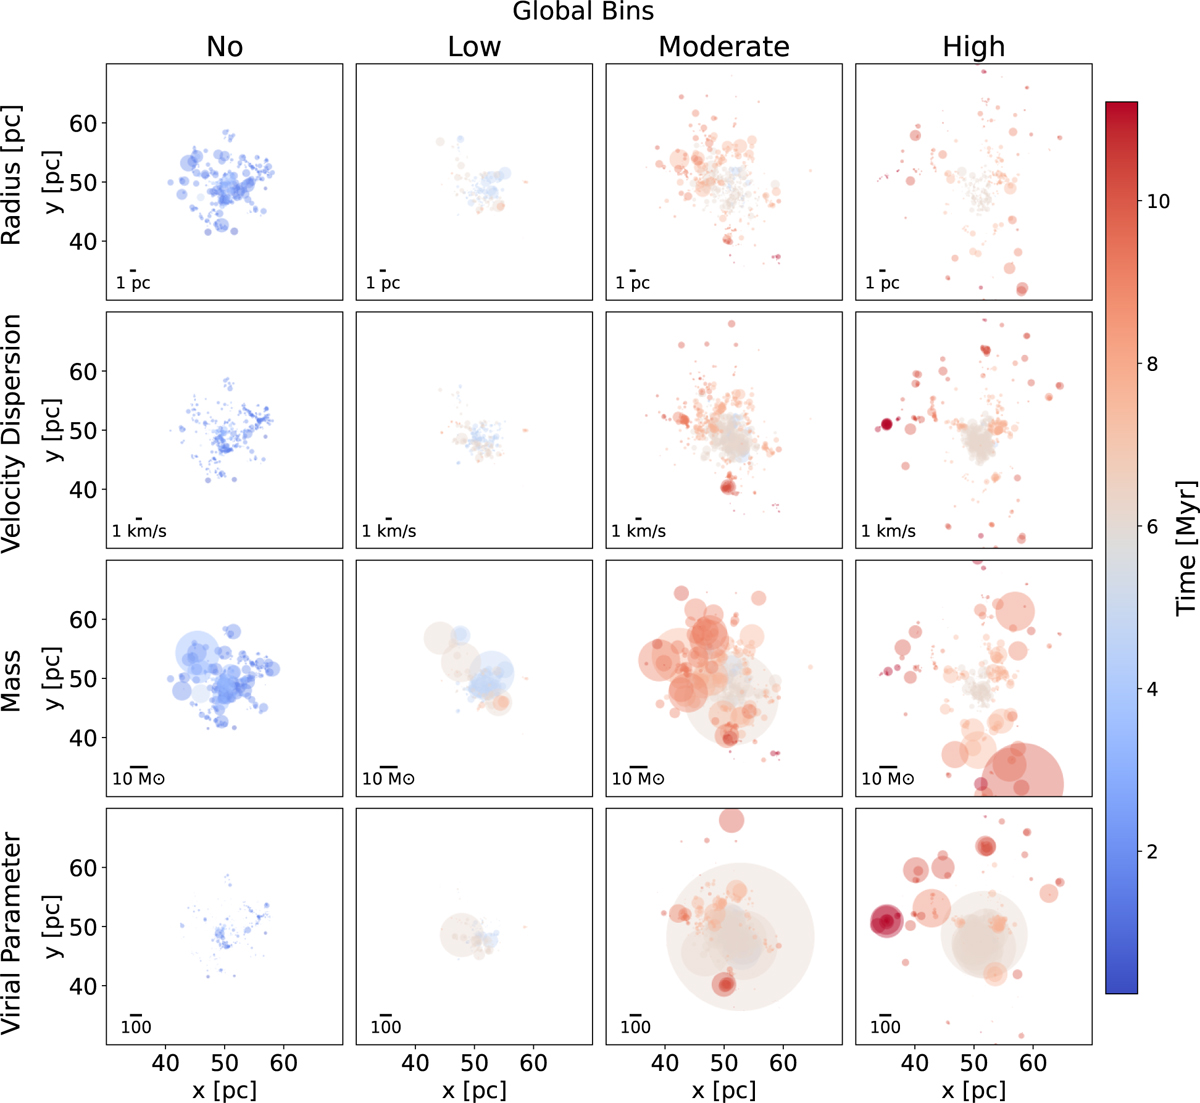
Distribution of cores in different snapshots along with their properties in various global feedback bins. The positions of the cores represent their locations in the simulation box. The cores are are assumed to be circular, and the core properties (Sect. 3) are scaled with the size of these circles. First row: Radius of the core. Second and third rows: Velocity dispersion and mass of the cores, respectively. Bottom row: Virial parameter. The colours represent the time elapsed (in Myr) since the start of the simulation.
Current usage metrics show cumulative count of Article Views (full-text article views including HTML views, PDF and ePub downloads, according to the available data) and Abstracts Views on Vision4Press platform.
Data correspond to usage on the plateform after 2015. The current usage metrics is available 48-96 hours after online publication and is updated daily on week days.
Initial download of the metrics may take a while.