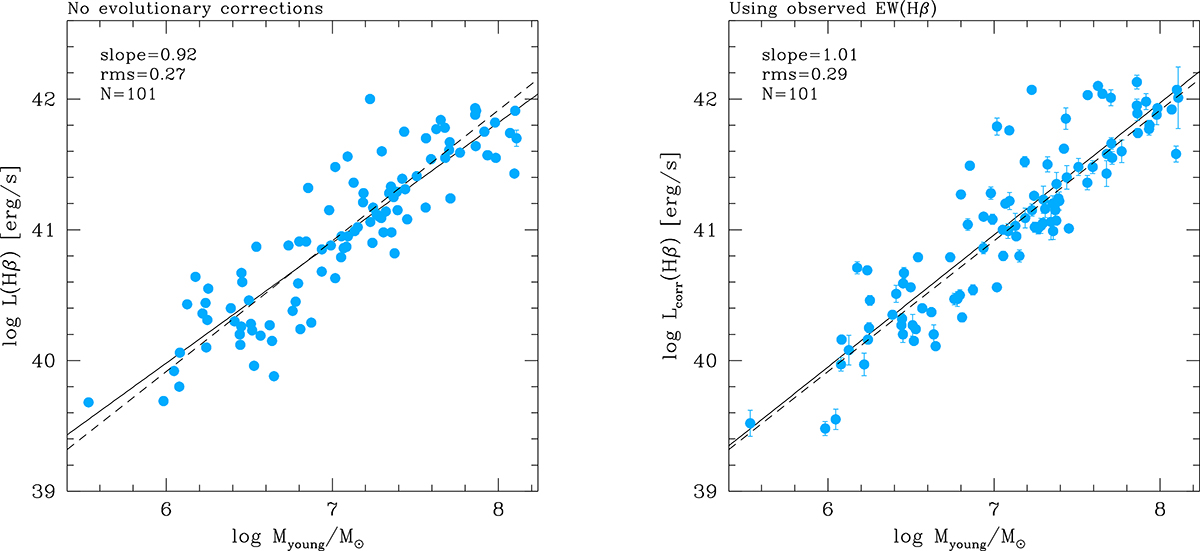
Fig. 9.
Download original image
Relation between photometric mass of young stars (Myoung) from CIGALE SED fits and the observed Hβ luminosity. Left. In this case, the observed Hβ luminosity is not corrected for evolution. Right. Same as left, but with Hβ luminosity corrected for evolution using the observed EW(Hβ). The solid lines shows a least-squares fits to the data; the dashed line plots the predictions of SB99 models. As is discussed in the text, this is a classical Stork diagram: the logarithm of the distance appears in both axes.
Current usage metrics show cumulative count of Article Views (full-text article views including HTML views, PDF and ePub downloads, according to the available data) and Abstracts Views on Vision4Press platform.
Data correspond to usage on the plateform after 2015. The current usage metrics is available 48-96 hours after online publication and is updated daily on week days.
Initial download of the metrics may take a while.