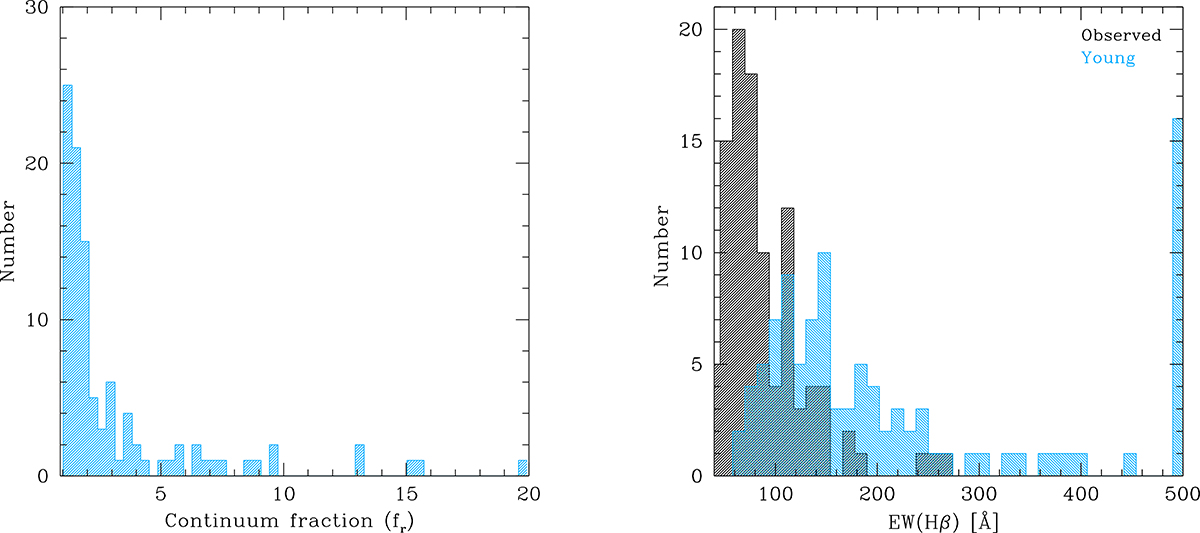
Fig. 4.
Download original image
Distributions of the SED fitting results showing the contamination of the continuum at Hβ by evolved stars. Left. Distribution of the correction factor fr values given by equation 1. The distribution peaks at fr= 1.1–1.2, indicating that while all the HII galaxies in this sample have significant underlying old and intermediate-age stellar populations, for most galaxies the effect in EW(Hβ) is seen to be below 50%. Right. Histograms of the distribution of observed EW(Hβ) in black, and corrected (Young) in blue using SED fitting. The distribution of ages [EW(Hβ)] of the young stellar populations is seen to be much flatter than the distribution of observed equivalent widths.
Current usage metrics show cumulative count of Article Views (full-text article views including HTML views, PDF and ePub downloads, according to the available data) and Abstracts Views on Vision4Press platform.
Data correspond to usage on the plateform after 2015. The current usage metrics is available 48-96 hours after online publication and is updated daily on week days.
Initial download of the metrics may take a while.