Fig. 3.
Download original image
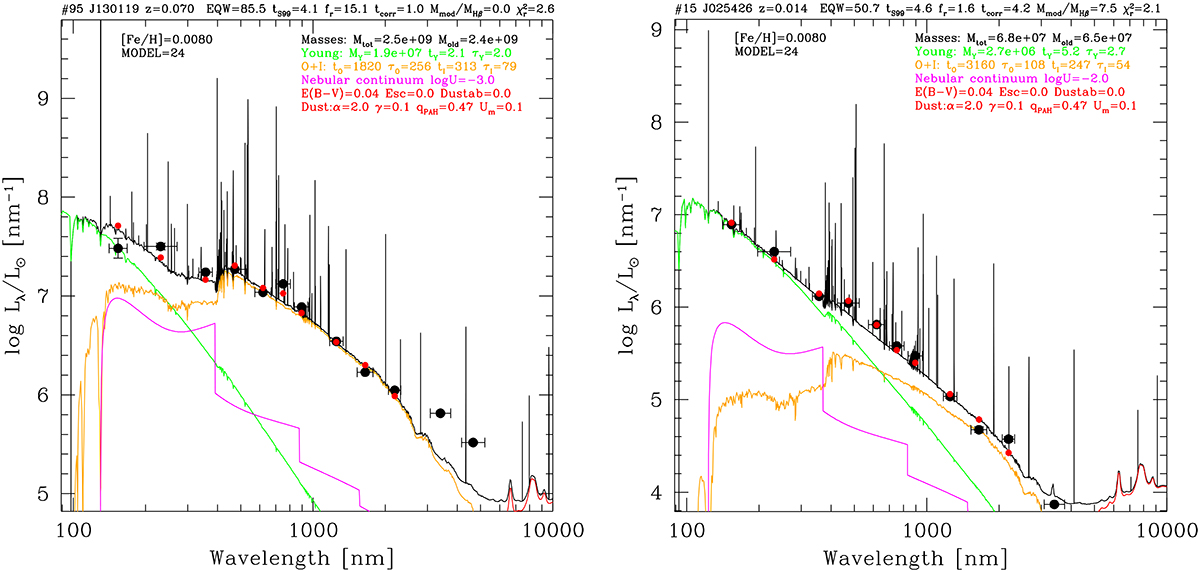
Examples of spectral energy distribution of two HII galaxies using CIGALE. The black line is the best fit from GIGALE to the observations shown by the black dots. The red dots are the best CIGALE fits convolved with the relevant filter bandpasses. The green line is the young stellar component fit and the orange line the old + intermediate age component. The red line is the dust emission model from Draine & Li (2007) for the parameters indicated in each figure legend; and the magenta line shows the nebular continuum. The top legends show several parameters, including the reduced χ2 of the solution. Left. CIGALE model fit for J130119. In this case, evolved stars dominate the continuum at most bands, so fr = 15.1. Right. Same as left, but for J025426, where the young stellar population dominates the continuum at Hβ; thus, fr = 1.6. The WISE W3 and W4 bands are shown for reference but were not used for the fits (no red dots). More information about these two galaxies is provided in the text.
Current usage metrics show cumulative count of Article Views (full-text article views including HTML views, PDF and ePub downloads, according to the available data) and Abstracts Views on Vision4Press platform.
Data correspond to usage on the plateform after 2015. The current usage metrics is available 48-96 hours after online publication and is updated daily on week days.
Initial download of the metrics may take a while.