Open Access
Fig. 2.
Download original image
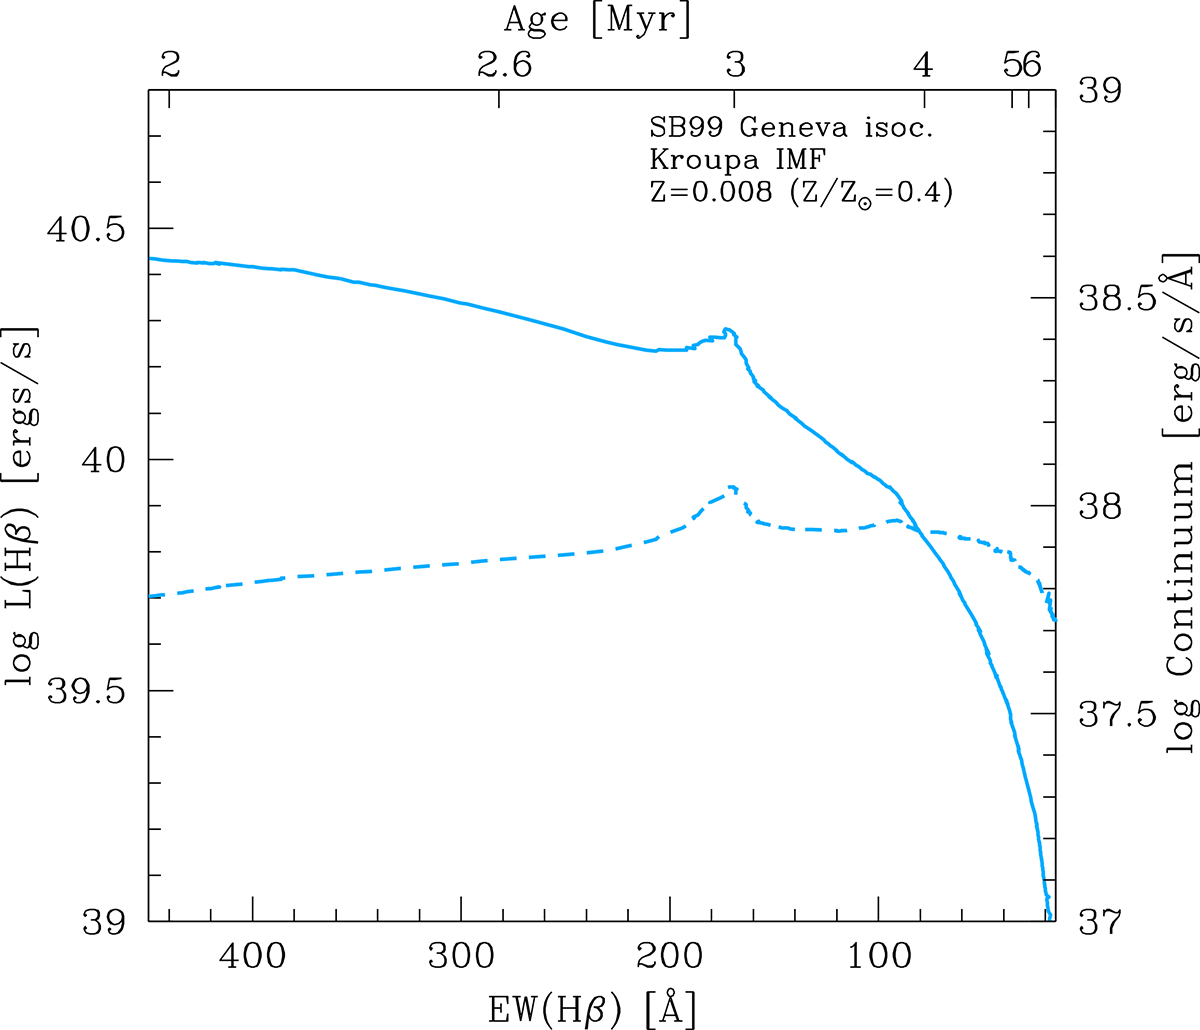
Starburst99 models showing the evolution of the Hβ and continuum luminosities of a single starburst as a function of the equivalent width of the Hβ emission line. The solid line shows the evolution of the line luminosity and the dashed line shows the evolution of the continuum under the line.
Current usage metrics show cumulative count of Article Views (full-text article views including HTML views, PDF and ePub downloads, according to the available data) and Abstracts Views on Vision4Press platform.
Data correspond to usage on the plateform after 2015. The current usage metrics is available 48-96 hours after online publication and is updated daily on week days.
Initial download of the metrics may take a while.