Open Access
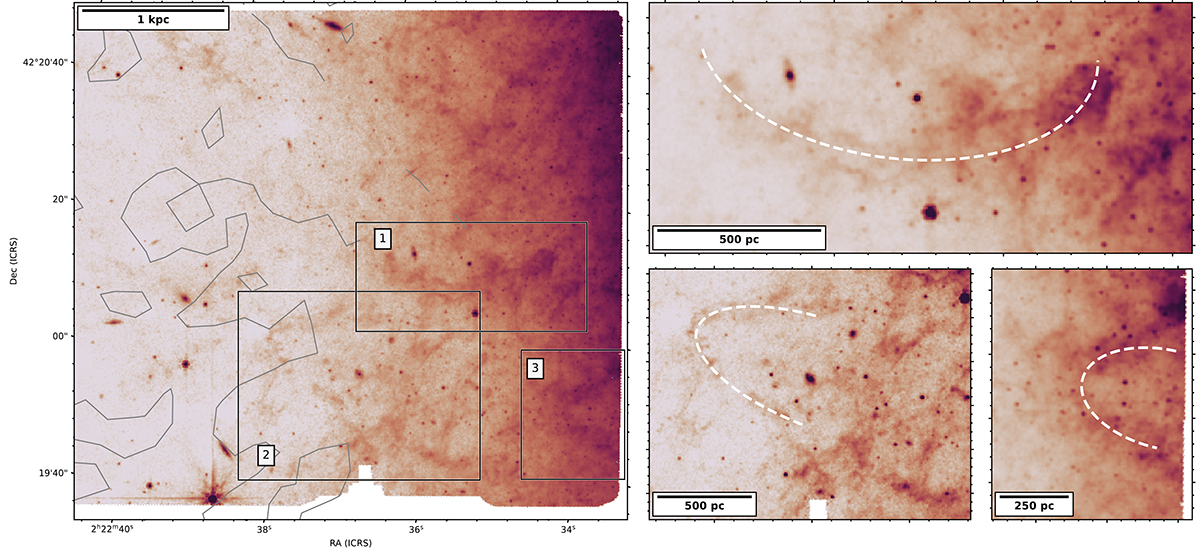
Fig. 7.
Download original image
Cut-out of the MIRI strip closest to the disk in the left panel, with soft X-ray 95th percentile contours in grey. We bring out three locations showing visible extended structures in boxes 1 through 3. These are shown on the right hand side, marked with arc-likes structures (by hand).
Current usage metrics show cumulative count of Article Views (full-text article views including HTML views, PDF and ePub downloads, according to the available data) and Abstracts Views on Vision4Press platform.
Data correspond to usage on the plateform after 2015. The current usage metrics is available 48-96 hours after online publication and is updated daily on week days.
Initial download of the metrics may take a while.