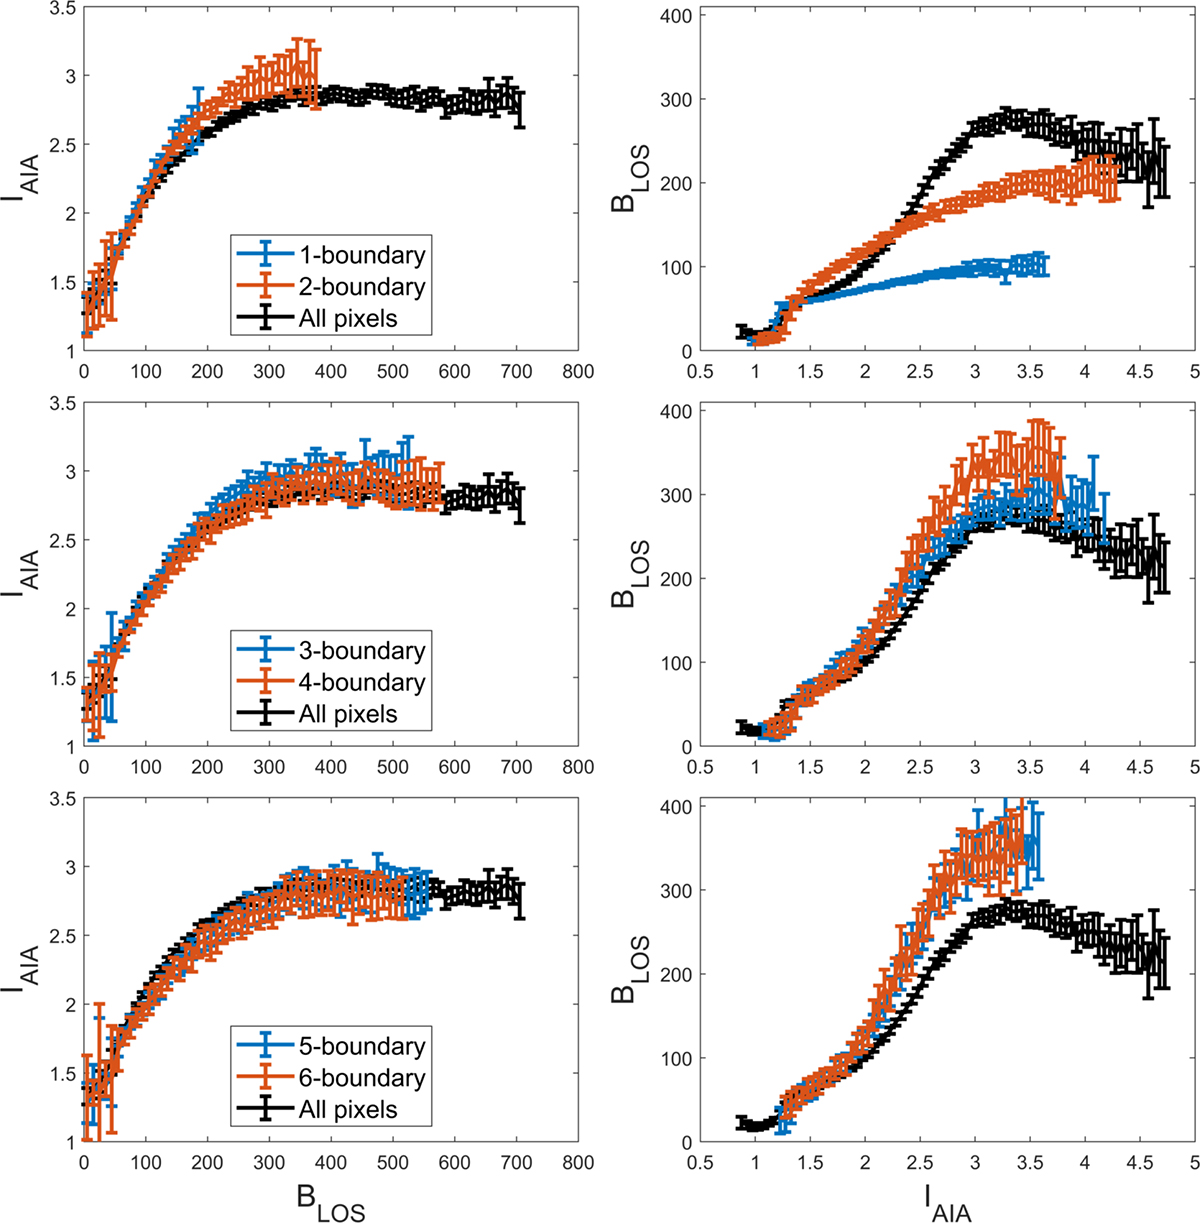
Fig. 9.
Download original image
Boundary relations for A > 1000 px activity clusters. Left column: Median AIA 1600 intensity as a function of BLOS binned in steps of ΔBVec = 10 G. Right column: Median BLOS intensity as a function of AIA 1600 binned in steps of ΔIAIA = 0.05. The first row shows the median relations for the 1-boundary (blue) and the 2-boundary (orange), the second for the 3-boundary and the 4-boundary, and the third for the 5-boundary and the 6-boundary. Black lines show the median relations calculated from all activity cluster pixels. Error bars show twice the bootstrap standard error. The bins that have fewer than 100 data points are omitted.
Current usage metrics show cumulative count of Article Views (full-text article views including HTML views, PDF and ePub downloads, according to the available data) and Abstracts Views on Vision4Press platform.
Data correspond to usage on the plateform after 2015. The current usage metrics is available 48-96 hours after online publication and is updated daily on week days.
Initial download of the metrics may take a while.