Open Access
Fig. 11.
Download original image
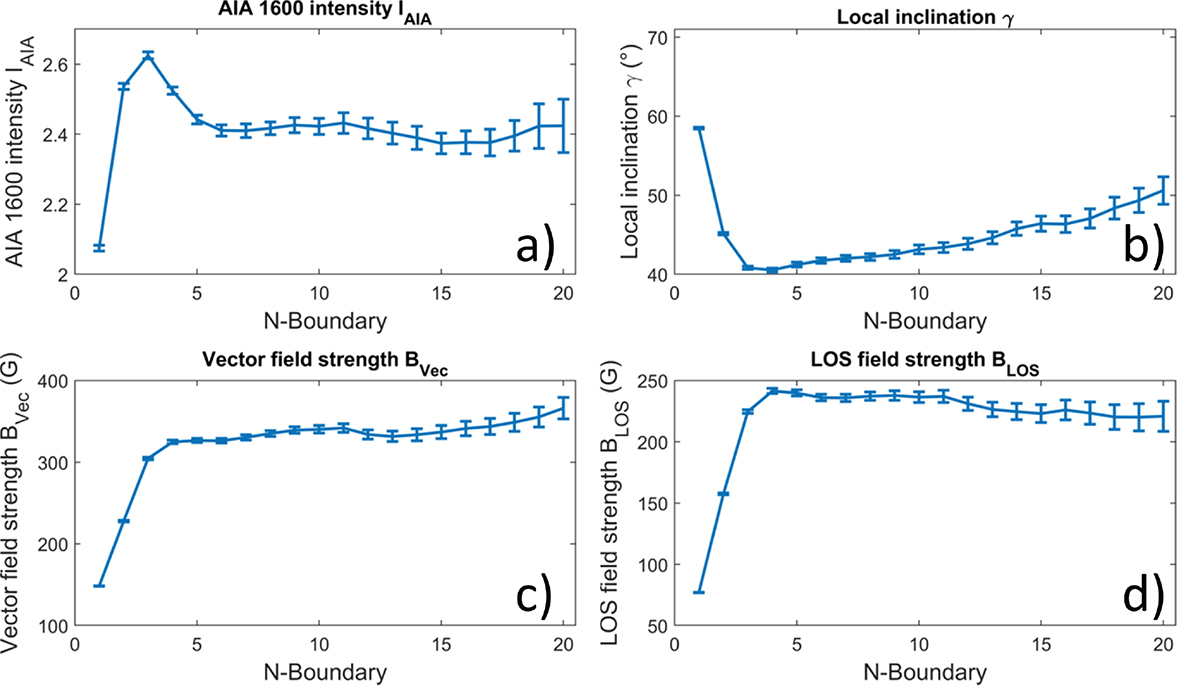
Boundary layer averages for A > 1000 px activity clusters. (a) AIA 1600 intensity. (b) Local inclination. (c) Vector field strength. (d) LOS field strength. Error bars correspond to twice the standard error of the mean.
Current usage metrics show cumulative count of Article Views (full-text article views including HTML views, PDF and ePub downloads, according to the available data) and Abstracts Views on Vision4Press platform.
Data correspond to usage on the plateform after 2015. The current usage metrics is available 48-96 hours after online publication and is updated daily on week days.
Initial download of the metrics may take a while.