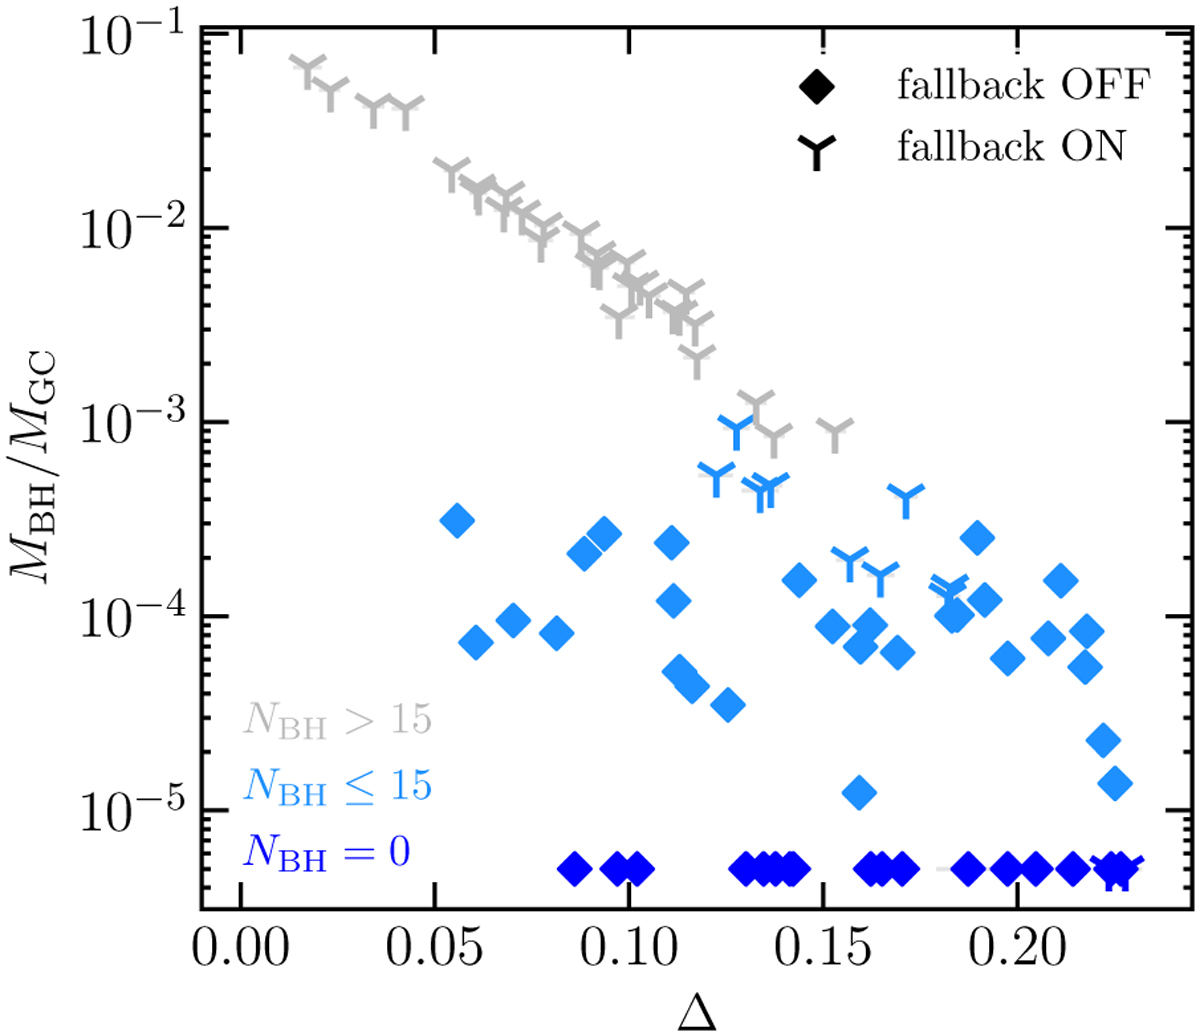
Fig. 2

Download original image
BH mass fraction as a function of Δ. Colors depict the number of BHs in the simulation at 13 Gyr, while different symbols show the adopted fallback prescription in the initial conditions. Simulations without BHs at 13 Gyr are shown at MBH/MGC = 5 × 10⁻⁶. To account for fluctuations in the estimates arising due to the discrete nature of the simulations, we performed 500 different projections along the LOS, and for each of them, we measured Δ. The values shown are the median ones. Errors obtained computing the 16% and 84% percentiles of the distribution are also shown although barely visible.
Current usage metrics show cumulative count of Article Views (full-text article views including HTML views, PDF and ePub downloads, according to the available data) and Abstracts Views on Vision4Press platform.
Data correspond to usage on the plateform after 2015. The current usage metrics is available 48-96 hours after online publication and is updated daily on week days.
Initial download of the metrics may take a while.


