Fig. 2
Download original image
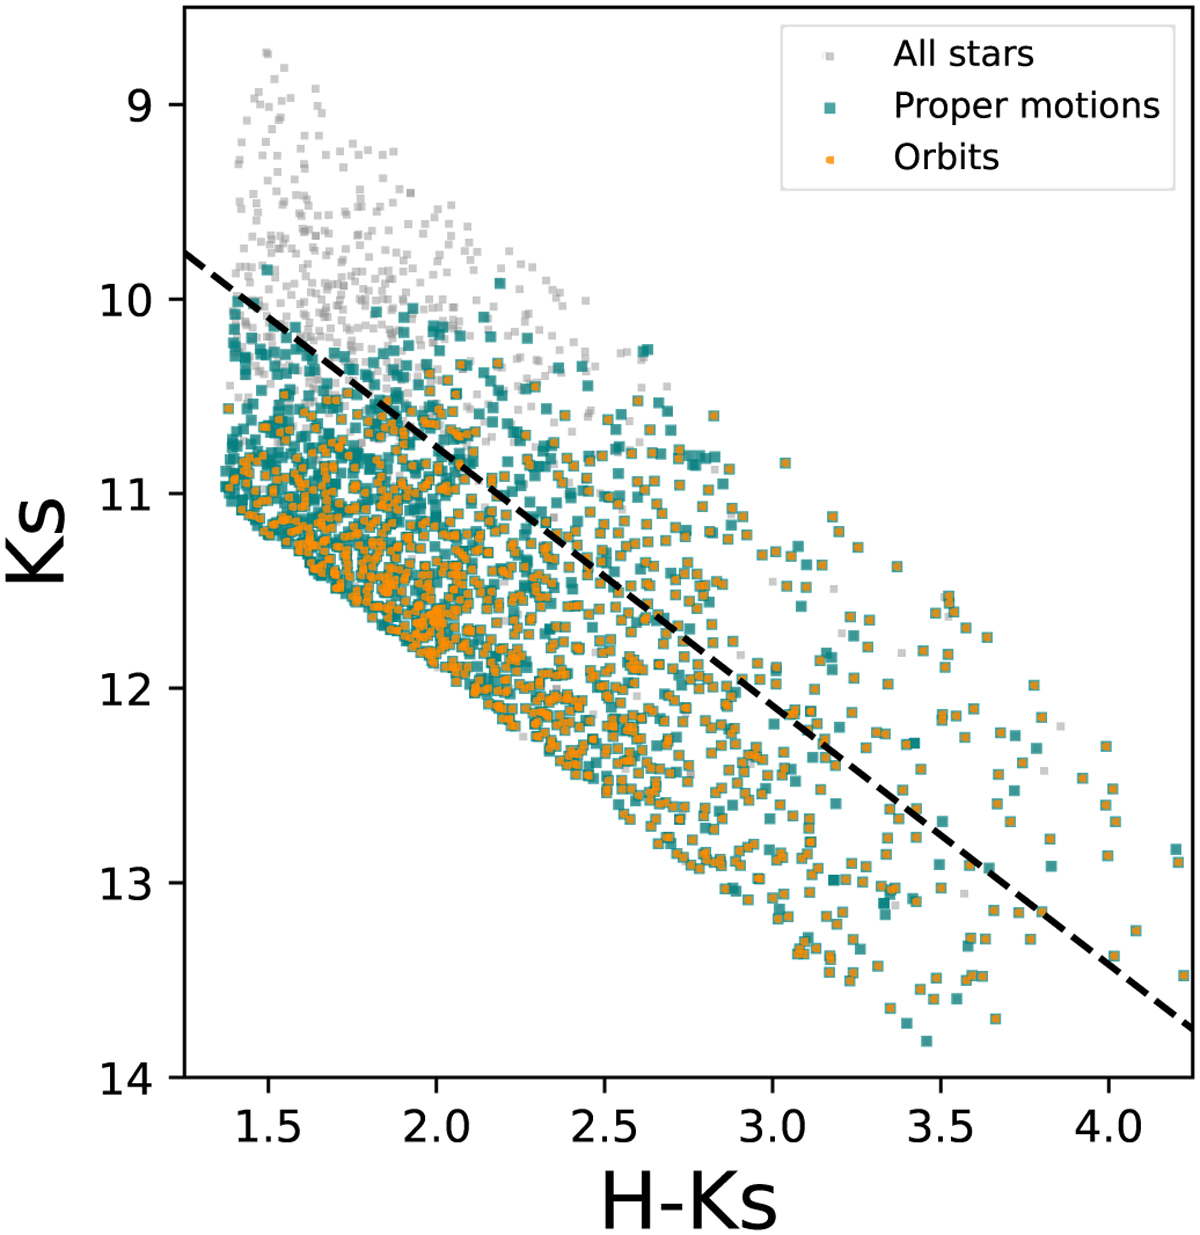
Colour-magnitude diagram Ks versus H − Ks. The grey dots represent all the stars in the KMOS catalogue in the analysed region after excluding the foreground population. Stars with proper motions below 1 mas/yr and stars with orbits are overplotted with different colours and symbols, as indicated in the legend. The black dashed line corresponds to the cut applied in Sects. 3, 4.2 and 5 to analyse the effect of missing bright stars at Ks ~ 10 mag when applying the proper motion quality cut.
Current usage metrics show cumulative count of Article Views (full-text article views including HTML views, PDF and ePub downloads, according to the available data) and Abstracts Views on Vision4Press platform.
Data correspond to usage on the plateform after 2015. The current usage metrics is available 48-96 hours after online publication and is updated daily on week days.
Initial download of the metrics may take a while.