Open Access
Fig. A.1
Download original image
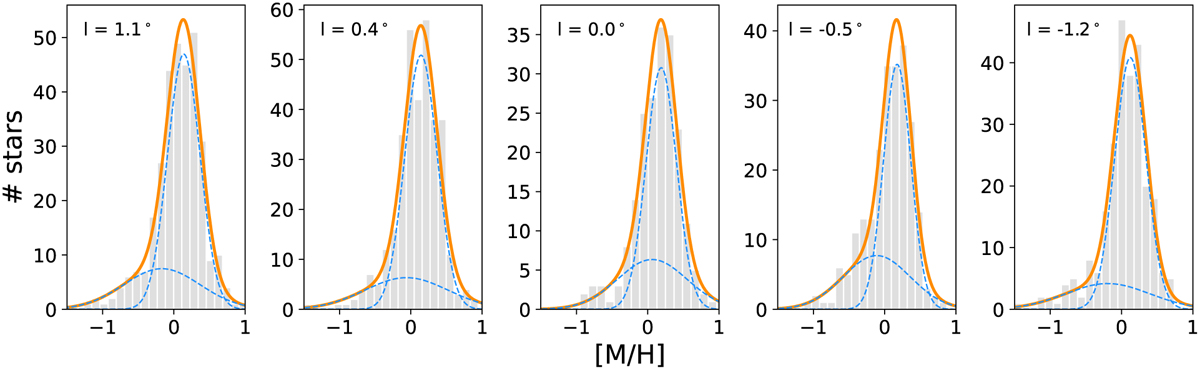
Two-Gaussian decomposition of the NSD metallicity distribution for different longitudes. The orange line shows the result of the GMM analysis, whereas the blue dashed lines depict each of the Gaussian components.
Current usage metrics show cumulative count of Article Views (full-text article views including HTML views, PDF and ePub downloads, according to the available data) and Abstracts Views on Vision4Press platform.
Data correspond to usage on the plateform after 2015. The current usage metrics is available 48-96 hours after online publication and is updated daily on week days.
Initial download of the metrics may take a while.