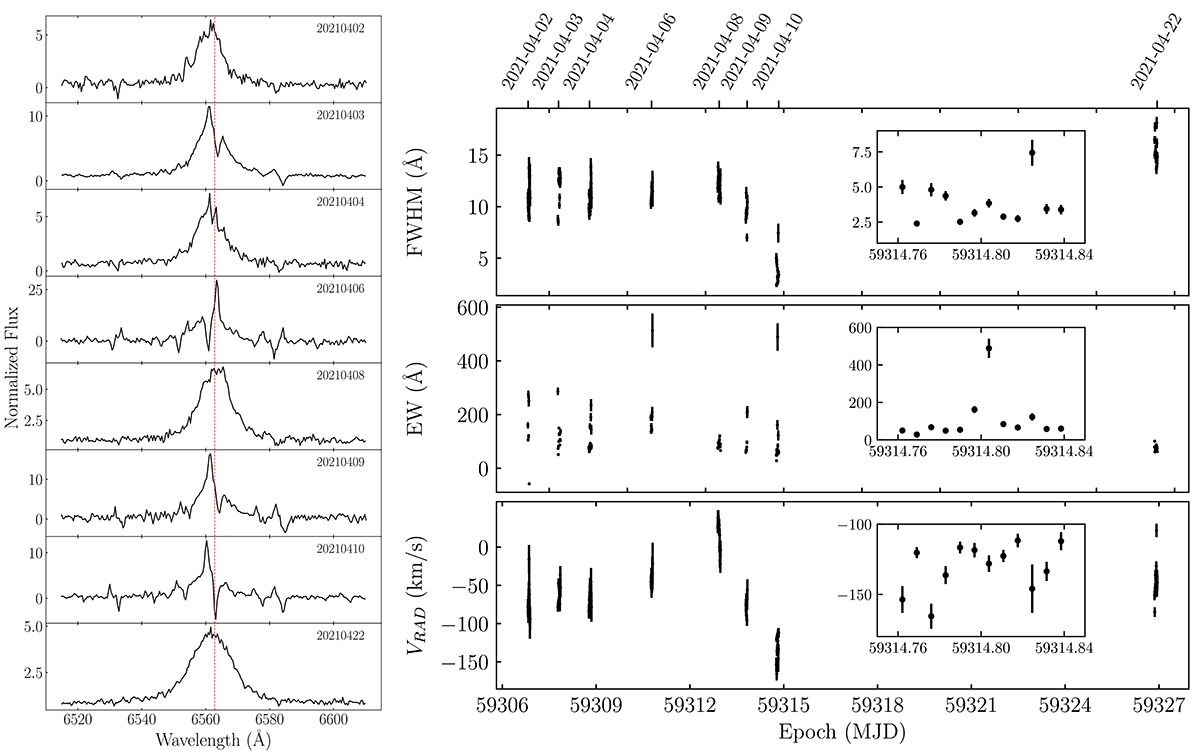
Fig. 7.
Download original image
Hα line profile variability and temporal evolution in 2021. Left: Nightly averaged SALT spectra of J1109 acquired in 2021, normalised to the continuum flux and restricted to the wavelength range encompassing the Hα line (highlighted by a dashed red vertical line). The dates when these spectra were obtained are indicated within each respective panel. Prominent variability in the line profile can be seen. Right: Time evolution of the parameters that characterise the Hα line profile. The insets show a zoom onto the values measured on 2021 April 10 (in most cases here, the size of the marker is larger than the error bars).
Current usage metrics show cumulative count of Article Views (full-text article views including HTML views, PDF and ePub downloads, according to the available data) and Abstracts Views on Vision4Press platform.
Data correspond to usage on the plateform after 2015. The current usage metrics is available 48-96 hours after online publication and is updated daily on week days.
Initial download of the metrics may take a while.