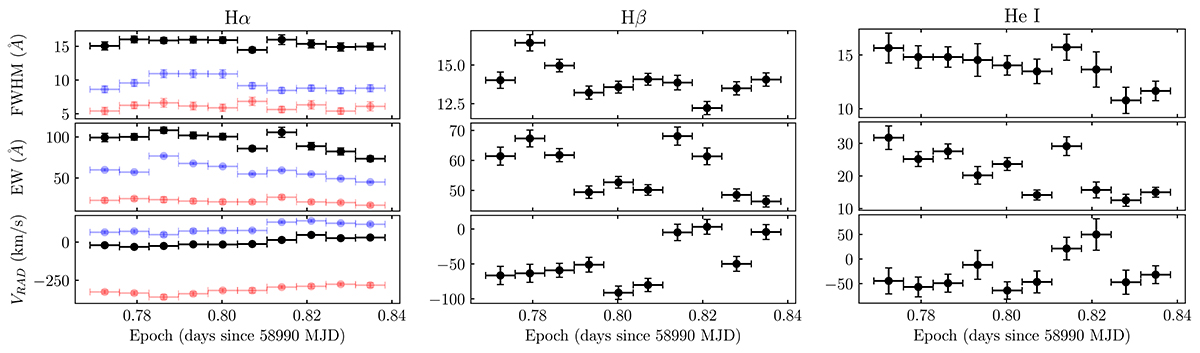
Fig. 6.
Download original image
Time evolution of the parameters that characterise the Hα (left), Hβ (middle), and He I (right) line profiles, extracted from the SALT spectra collected in 2020. For the case of the Hα line, we show the results obtained with a single Gaussian fit (black) and with two Gaussian fits (transparent colours) to model the blue and red components.
Current usage metrics show cumulative count of Article Views (full-text article views including HTML views, PDF and ePub downloads, according to the available data) and Abstracts Views on Vision4Press platform.
Data correspond to usage on the plateform after 2015. The current usage metrics is available 48-96 hours after online publication and is updated daily on week days.
Initial download of the metrics may take a while.