Fig. 3.
Download original image
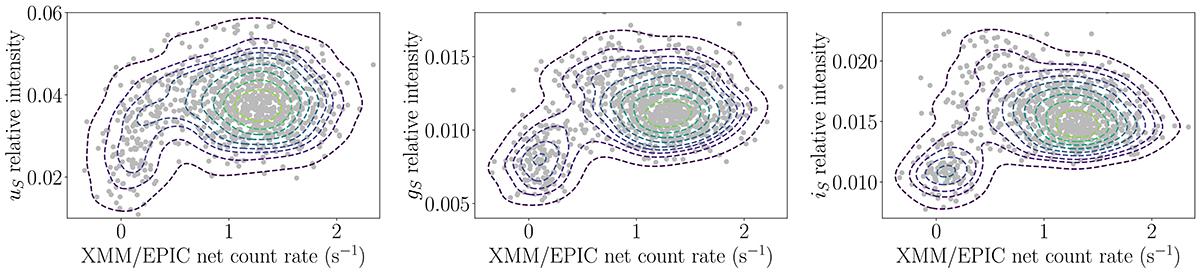
Scatter plots showing the relationship between the X-ray net count rates and optical intensities in different bands. The dashed lines represent iso-proportion levels of the density of data points, with the lowest level set at 5% of the peak density. These lines are colour coded, with light colours indicating the highest densities and dark colours indicating the lowest densities.
Current usage metrics show cumulative count of Article Views (full-text article views including HTML views, PDF and ePub downloads, according to the available data) and Abstracts Views on Vision4Press platform.
Data correspond to usage on the plateform after 2015. The current usage metrics is available 48-96 hours after online publication and is updated daily on week days.
Initial download of the metrics may take a while.